Warning: Javascript must be enabled to use all the features on this page!


Page Loading - Please Wait...

* We've detected you're using a mobile device. Find our Next Generation Station Page here.
Click to hideNews Bulletins
! This page is undergoing modernization with expected decommissioning as key features are added to the modernized pages.
Learn more about our modernization plans to find out which options will suit you best. Next Generation Monitoring Location Page is available now.

USGS 0158397967 MINEBANK RUN NEAR GLEN ARM, MD

PROVISIONAL DATA SUBJECT TO REVISION

Click to hidestation-specific text

LOCATION.--Lat 39°24'34.6", long 76°33'26.1", Baltimore County, MD, Hydrologic Unit 02060003, 
   on left bank, 1500 ft upstream from Sherwood Bridge in Cromwell Valley Park, 1.4 mi upstream 
   from mouth, 1.6 mi northwest of Carney, and 4.5 mi southwest of Glen Arm.
DRAINAGE AREA.--2.06 mi2.
PERIOD OF RECORD.--October 2001 to current year.
REVISIONS HISTORY.--https://waterdata.usgs.gov/nwis/dv/?site_no=0158397967: 2016.
   https://waterdata.usgs.gov/nwis/dv/?site_no=0158397967: 2015-2018.
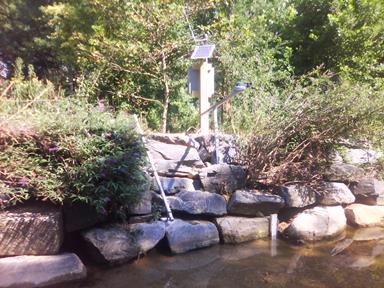
GAGE.--Water-stage recorder and crest-stage gage. Datum of gage is 216.25 ft above North American 
   Vertical Datum of 1988. October 2010 to July 2022, datum published as 216.12 ft above North American 
   Vertical Datum of 1988. October 2001 to September 2010, datum published as 216.88 ft above National
   Geodetic Vertical Datum of 1929. Prior to August 14, 2015, gage located on 
   left bank, 190 ft downstream, at same gage datum.
REMARKS.--U.S. Geological Survey satellite data-collection platform at station. 
EXTREMES FOR PERIOD OF RECORD.--Maximum discharge, 1,800 ft3/s, July 14, 2015, gage height, 9.15 ft;
   Maximum gage height, 10.41 ft, Aug. 13, 2018, at site currently in use; minimum discharge
   measurement, 0.04 ft3/s, August 21, 2002; instantaneous discharge may have been lower
   during periods of estimated record between August 1, and September 25, 2002.
COOPERATION.--Funding for the operation of this station is provided by the Baltimore County Department 
   of Environmental Protection and Sustainability, and the U.S. Geological Survey.
Boating safety tips
This station managed by the MD-DE-DC Water Science Center Baltimore office.

Available Parameters Available Period
  
2001-10-16  2024-04-26
2007-10-01  2024-04-26
2022-12-22  2024-04-26


 (7)
 

  -- or --


Summary of all available data for this site
Instantaneous-data availability statement


Discharge, cubic feet per second

Most recent instantaneous value: 1.48 04-26-2024   19:34 EDT
Graph of  Discharge, cubic feet per second

Add up to 2 more sites and replot for "Discharge, cubic feet per second"

?


Create presentation-quality / stand-alone graph.   Subscribe to WaterAlert      

See this graph on the Monitoring Location Pages


Daily discharge, cubic feet per second -- statistics for Apr 26 based on 22 water years of record more
Min
(2023)
25th
percen-
tile
Most Recent
Instantaneous
Value Apr 26
Median Mean 75th
percen-
tile
Max
(2004)
0.62 1.3 1.48 2 3.4 3.6 12.9


Gage height, feet

Most recent instantaneous value: 4.24 04-26-2024   19:34 EDT
Graph of  Gage height, feet

Add up to 2 more sites and replot for "Gage height, feet"

?


Create presentation-quality / stand-alone graph.   Subscribe to WaterAlert      

See this graph on the Monitoring Location Pages


Stream water level elevation above NAVD 1988, in feet

Most recent instantaneous value: 220.49 04-26-2024   19:34 EDT
Graph of  Stream water level elevation above NAVD 1988, in feet

Add up to 2 more sites and replot for "Stream water level elevation above NAVD 1988, in feet"

?


Create presentation-quality / stand-alone graph.   Subscribe to WaterAlert      

See this graph on the Monitoring Location Pages