Warning: Javascript must be enabled to use all the features on this page!


Page Loading - Please Wait...

* We've detected you're using a mobile device. Find our Next Generation Station Page here.
Click to hideNews Bulletins
! This page is undergoing modernization with expected decommissioning as key features are added to the modernized pages.
Learn more about our modernization plans to find out which options will suit you best. Next Generation Monitoring Location Page is available now.

USGS 01589795 SOUTH FORK JABEZ BRANCH AT MILLERSVILLE, MD

PROVISIONAL DATA SUBJECT TO REVISION

Click to hidestation-specific text
Click for larger images LOCATION.--Lat 39°04'05.7", long 76°39'05.5", Anne Arundel County, MD, Hydrologic Unit 02060004, on right bank 300 ft upstream from confluence with West Branch Jabez Branch, 0.5 mi northwest of Millersville, 1.0 mi west of Gambrills, and 1.6 mi upstream from mouth.
DRAINAGE AREA.--1.0 mi2.
PERIOD OF RECORD.--August 1989 to September 1990, July 1997 to current year.
REVISIONS HISTORY.--https://waterdata.usgs.gov/nwis/dv/?site_no=01589795: 2011-2015.
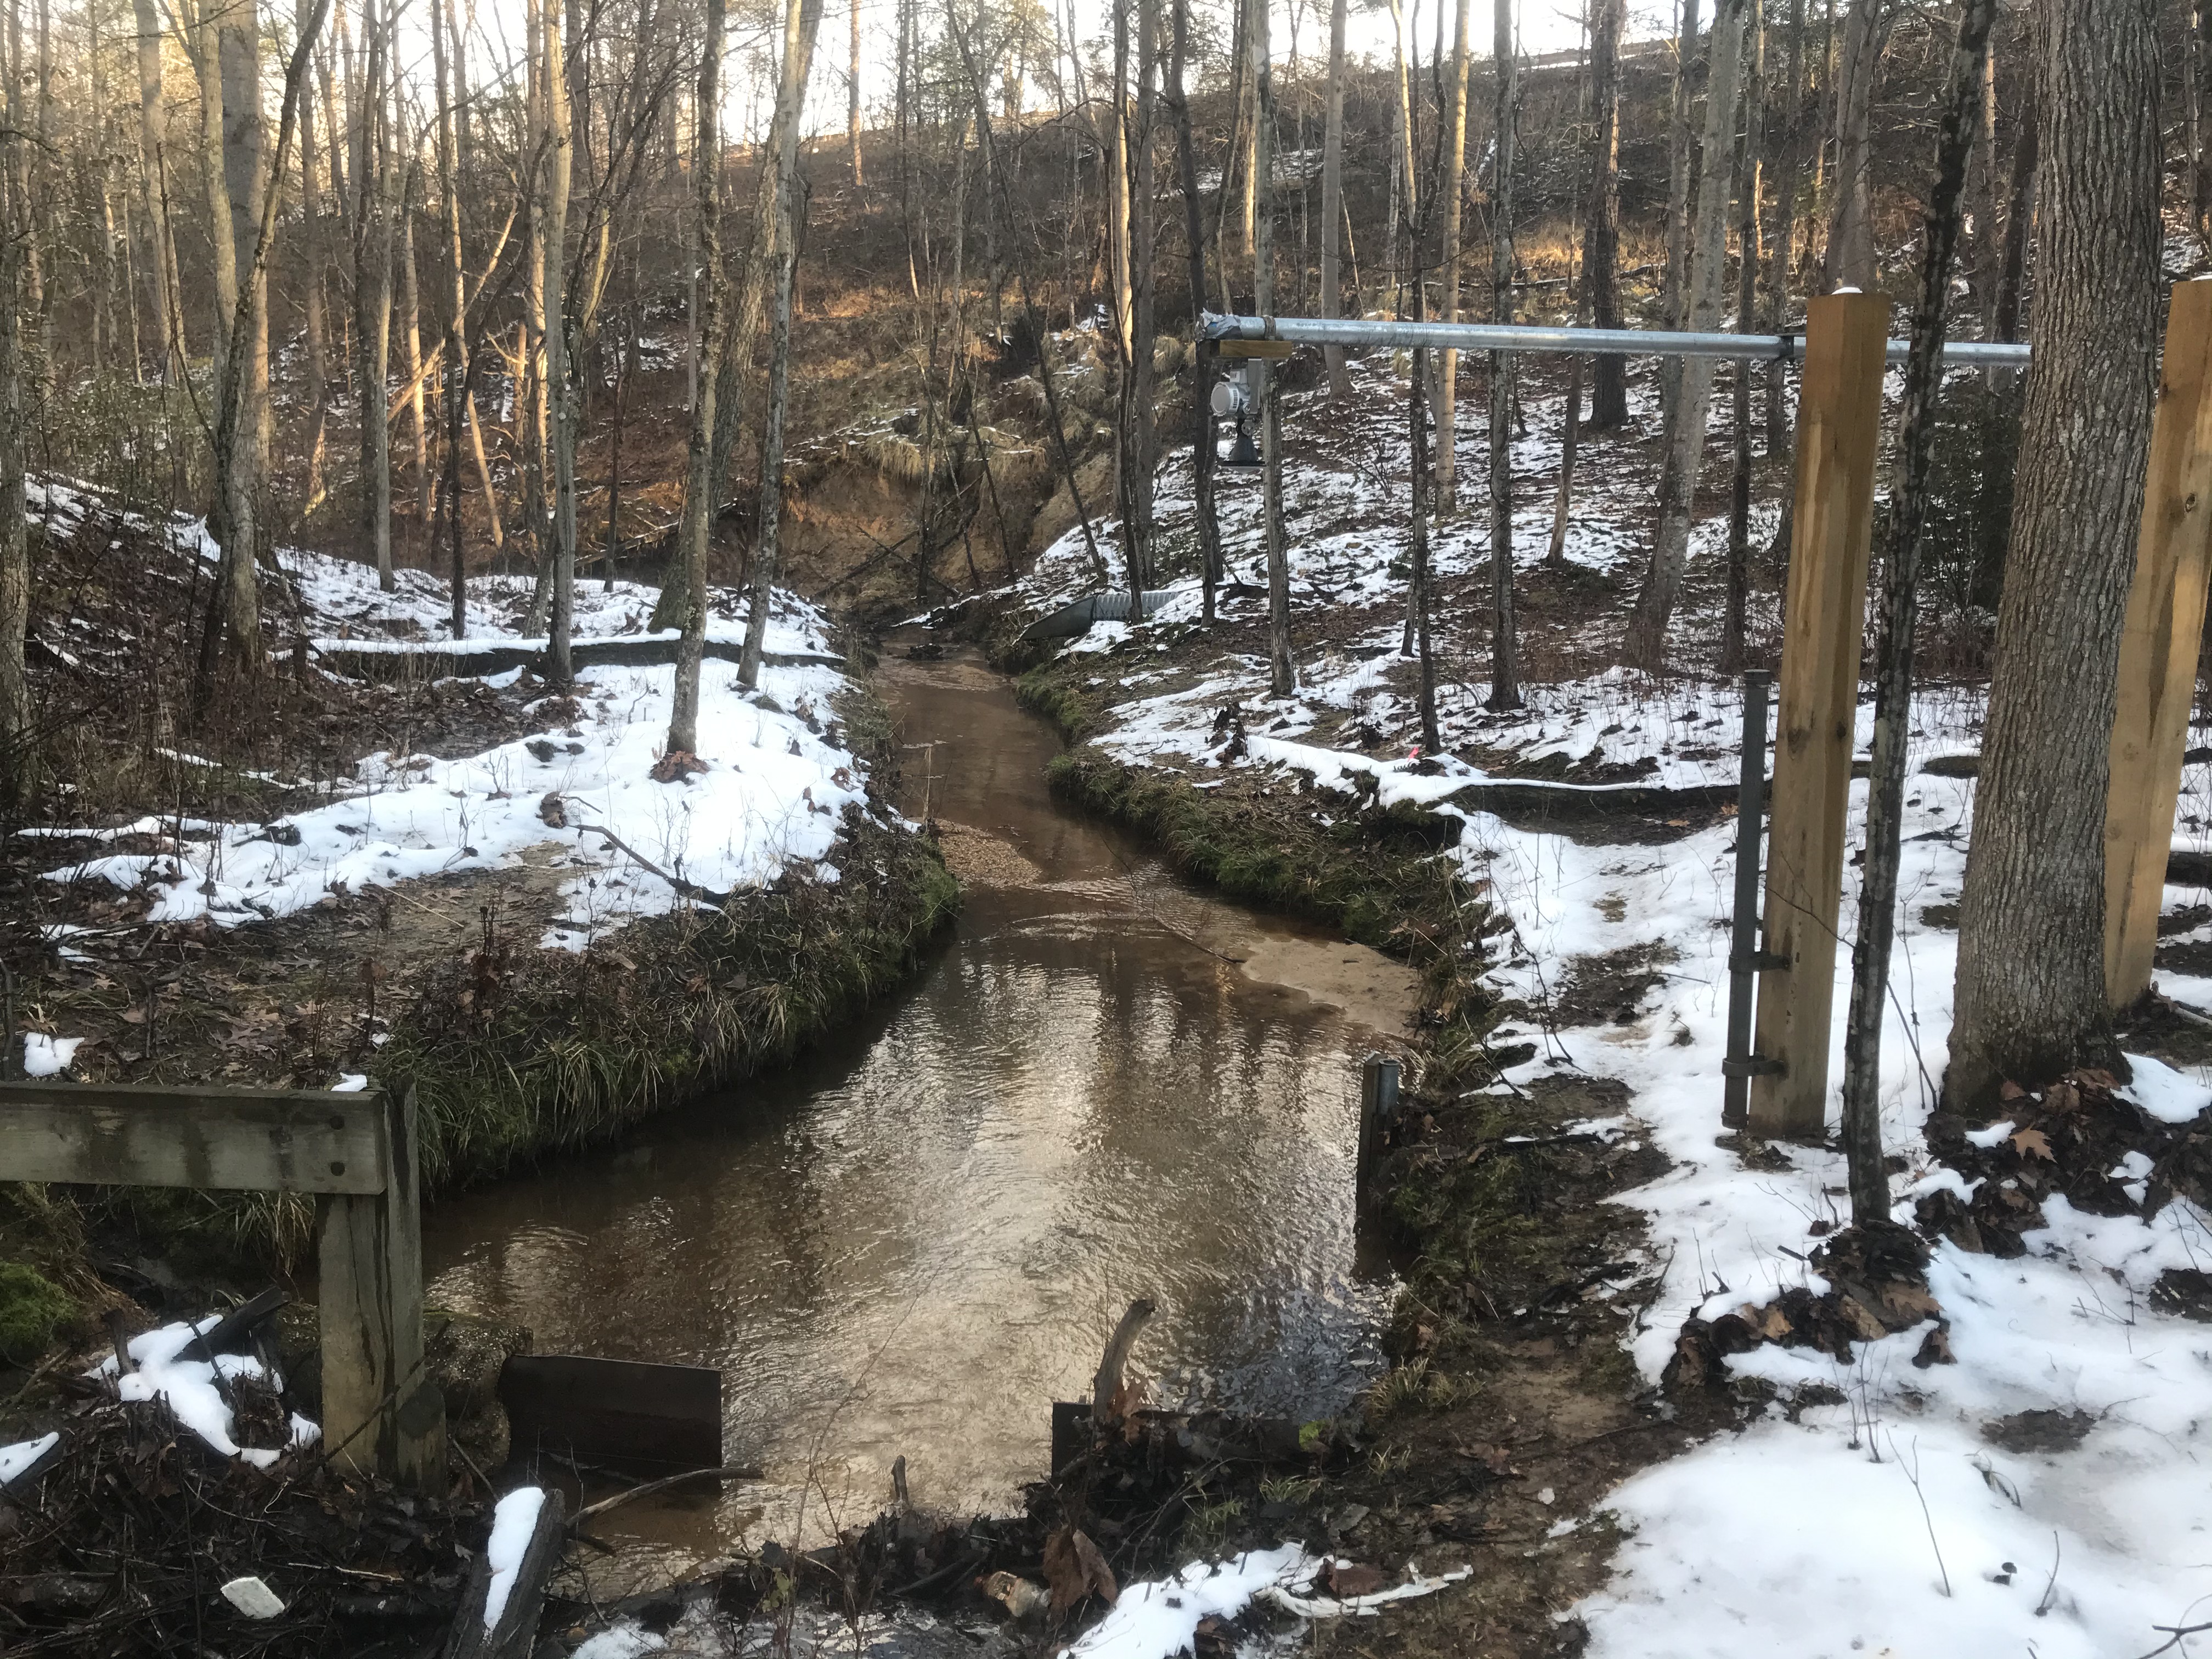
GAGE.--Water-stage recorder and crest-stage gage. Datum of gage is 53.61 ft above North American Vertical Datum of 1988. Prior to Nov. 19, 2019, water-stage recorder, crest-stage gage, and sharp-crested weir on left bank at same site and gage datum.
REMARKS.--U.S. Geological Survey satellite data-collection platform at station.
EXTREMES FOR PERIOD OF RECORD.--Maximum discharge, 1,430 ft3/s, Sept. 8, 2011, gage height, 13.75 ft; minimum discharge, 0.02 ft3/s, Aug. 1, 12, 2010.
COOPERATION.--Funding for the operation of this station is provided by the Anne Arundel County Department of Public Works.
This station managed by the MD-DE-DC Water Science Center Baltimore office.

Available Parameters Available Period
  
1989-08-29  2024-05-01
2007-10-01  2024-05-01


 (7)
 

  -- or --


Summary of all available data for this site
Instantaneous-data availability statement


Discharge, cubic feet per second

Most recent instantaneous value: 0.31 05-01-2024   17:55 EDT
Graph of

Add up to 2 more sites and replot for "Discharge, cubic feet per second"

?


Create presentation-quality / stand-alone graph.   Subscribe to WaterAlert      

See this graph on the Monitoring Location Pages


Daily discharge, cubic feet per second -- statistics for May 1 based on 27 water years of record more
Min
(2018)
25th
percen-
tile
Most Recent
Instantaneous
Value May 1
Median 75th
percen-
tile
Mean Max
(2014)
0.11 0.24 0.31 0.37 0.45 0.58 5.17


Gage height, feet

Most recent instantaneous value: 3.38 05-01-2024   17:55 EDT
Graph of

Add up to 2 more sites and replot for "Gage height, feet"

?


Create presentation-quality / stand-alone graph.   Subscribe to WaterAlert      

See this graph on the Monitoring Location Pages