Warning: Javascript must be enabled to use all the features on this page!


Page Loading - Please Wait...

Click to hideNews Bulletins
! This page is undergoing modernization with expected decommissioning as key features are added to the modernized pages.
Learn more about our modernization plans to find out which options will suit you best. Next Generation Monitoring Location Page is available now.

USGS 01593450 L PAX RIV TRIB ABOVE LAKE ELKHORN NR GUILFORD, MD

PROVISIONAL DATA SUBJECT TO REVISION

Click to hidestation-specific text
LOCATION.--Lat 39°11'16.4", long 76°49'50.6", Howard County, MD, Hydrologic Unit 02060006, on 
   right bank, approximately 300 ft downstream from culvert on Oakland Mills Road, 1.1 mi north 
   of Guilford, and 0.3 mi upstream from mouth. 
DRAINAGE AREA.--2.47 mi2, from automated delineation using 30-meter National Elevation 
   Dataset, digital elevation model data, dated 2007.
PERIOD OF RECORD.--October 2012 to present.
REVISIONS HISTORY.--https://waterdata.usgs.gov/nwis/dv/?site_no=01593450: 2017.
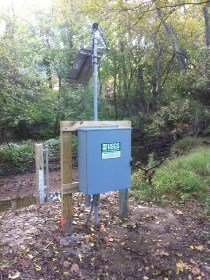
GAGE.--Water-stage recorder. Datum of gage is 298.89 ft above North American
   Vertical Datum of 1988.
REMARKS.--U.S. Geological Survey satellite data-collection platform at station.
EXTREMES FOR PERIOD OF RECORD.--Maximum discharge, 2,730 ft³/s, July 29, 2017, gage height, 6.76 ft;
   minimum discharge, 0.20 ft³/s, Nov. 19, 2016, Sept. 30, 2017. 
COOPERATION.--Funding for the operation of this station is provided by the Columbia Association.
This station managed by the MD-DE-DC Water Science Center Baltimore office.

Available Parameters Available Period
  
2012-10-01  2024-04-30
2012-10-01  2024-04-30


 (7)
 

  -- or --


Summary of all available data for this site
Instantaneous-data availability statement


Discharge, cubic feet per second

Most recent instantaneous value: 2.52 04-30-2024   04:25 EDT
Graph of  Discharge, cubic feet per second

Add up to 2 more sites and replot for "Discharge, cubic feet per second"

?


Create presentation-quality / stand-alone graph.   Subscribe to WaterAlert      

See this graph on the Monitoring Location Pages


Daily discharge, cubic feet per second -- statistics for Apr 30 based on 11 water years of record more
Min
(2017)
25th
percen-
tile
Median Most Recent
Instantaneous
Value Apr 30
75th
percen-
tile
Mean Max
(2014)
1.18 1.5 2.3 2.52 8 26 238


Gage height, feet

Most recent instantaneous value: 0.86 04-30-2024   04:25 EDT
Graph of  Gage height, feet

Add up to 2 more sites and replot for "Gage height, feet"

?


Create presentation-quality / stand-alone graph.   Subscribe to WaterAlert      

See this graph on the Monitoring Location Pages