Warning: Javascript must be enabled to use all the features on this page!


Page Loading - Please Wait...

* We've detected you're using a mobile device. Find our Next Generation Station Page here.
Click to hideNews Bulletins
! This page is undergoing modernization with expected decommissioning as key features are added to the modernized pages.
Learn more about our modernization plans to find out which options will suit you best. Next Generation Monitoring Location Page is available now.

USGS 03041029 Conemaugh River at Minersville, PA

PROVISIONAL DATA SUBJECT TO REVISION

Click to hidestation-specific text
Funding for this site is provided by:


Station gage imageSTATION.--
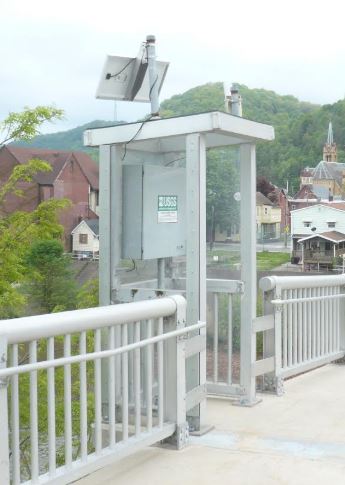
03041029 CONEMAUGH RIVER AT MINERSVILLE, PA
LOCATION.--Lat 40`20'29", long 78`55'34", Cambria County, Hydrologic Unit 05010007, at iron truss reinforced concrete deck bridge on Fourth Ave., 2,100 ft northeast of State Highways 56 and 403 at Johnstown, and 4,000 ft downstream from confluence of Little Conemaugh River and Stony Creek.
DRAINAGE AREA.--678 square miles.
PERIOD OF RECORD.--December 2001 to current year.
GAGE.--Water-stage recorder and crest-stage gage. Datum of gage is 1140 ft above National Geodetic Vertical Datum of 1929. Satellite telemetry at station.
COOPERATION.--Station established and maintained by the U.S. Geological Survey.
REMARKS.--Flow regulated by steel mills and reservoirs above the station. During low-flow, possible industrial diversion/discharge from Johnstown.
GAGE HEIGHTS OF IMPORTANCE.-
Supplied by NWS: Action stage: 23 ft; Flood stage: 28 ft; Moderate flood stage: 30 ft; Major flood stage: 34 ft.
This station managed by the PAWSC Pittsburgh Field Office.

Available Parameters Available Period
  
2001-12-13  2023-05-31
2007-10-01  2023-05-31


 (7)
 

  -- or --


Summary of all available data for this site
Instantaneous-data availability statement


Discharge, cubic feet per second

Most recent instantaneous value: 373 05-31-2023   00:15 EDT
Graph of  Discharge, cubic feet per second

Add up to 2 more sites and replot for "Discharge, cubic feet per second"

?


Create presentation-quality / stand-alone graph.   Subscribe to WaterAlert      

See this graph on the Monitoring Location Pages


Daily discharge, cubic feet per second -- statistics for May 31 based on 21 water years of record more
Min
(2007)
Most Recent
Instantaneous
Value May 31
25th
percen-
tile
Median Mean 75th
percen-
tile
Max
(2019)
342 373 661 978 1150 1290 3580


Gage height, feet

Most recent instantaneous value: 1.87 05-31-2023   00:15 EDT
Graph of  Gage height, feet

Add up to 2 more sites and replot for "Gage height, feet"

?


Create presentation-quality / stand-alone graph.   Subscribe to WaterAlert      

See this graph on the Monitoring Location Pages