LOCATION.--Lat 43°15'35.3", long
76°00'10.0" referenced to North American Datum of
1983, Oswego County, NY, Hydrologic Unit 04140202, on right
bank 8 ft upstream from Cemetery Road, 0.8 mi north of
Constantia and 1.1 mi upstream from mouth.
DRAINAGE AREA.--39.8 mi².
PERIOD OF RECORD.--March 1966 to September 1968. Water
years 1969, 1971-98, 2000-14 (annual maximum only). October
2014 to current year.
REVISIONS HISTORY.--WDR NY-79-1: 1974 (date of peak).
WDR NY-81-3: 1973-80 (M). Gage height and discharge for the
period Feb. 12, 2018 to June 19, 2018 were revised on May 13,
2019, based on changes to the gage height data source.
GAGE.--Water-stage recorder and crest-stage
gage. Datum of gage is 401.49 ft above NAVD of 1988.
Water Years 2015-21: Records fair except those for estimated
daily discharges, which are poor. Water Year 2022: Records
good except those for estimated daily discharges, which are
poor.
EXTREMES FOR PERIOD OF RECORD.--Maximum discharge, 1,310
ft³/s, Sept. 26, 1975, gage height, 7.33 ft; maximum gage
height, 7.42 ft, June 22, 1972; minimum discharge, 3.9
ft³/s, Aug. 9, 2016, gage height, 1.28 ft.

 Site Information
 WaterAlert – get an
email or text (SMS) alert based on your chosen threshold.
WaterAlert – get an
email or text (SMS) alert based on your chosen threshold.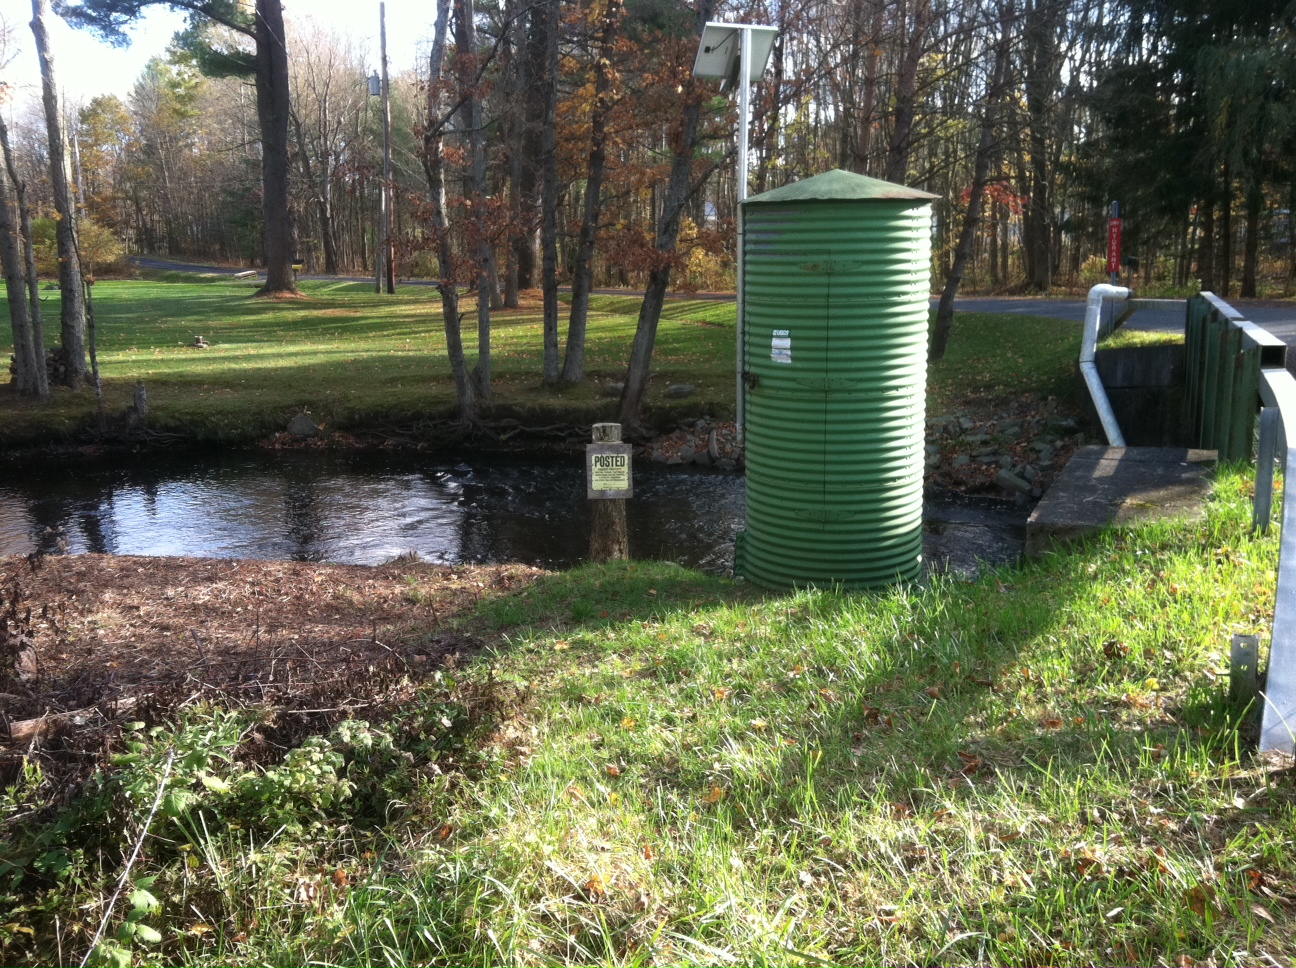 Station image
