LOCATION.--Lat 44°13'21.2", long
75°04'27.5" referenced to North American Datum of
1983, St. Lawrence County, NY, Hydrologic Unit 04150302, on
left bank 300 ft downstream from powerplant, and 2.8 mi north
of Oswegatchie.
DRAINAGE AREA.--259 mi².
PERIOD OF RECORD.--October 1924 to September 1968,
annual maximum only--1985, July 1987 to current year. Prior to
October 1958, published as East Branch Oswegatchie River near
Oswegatchie.
REVISIONS HISTORY.--WDR NY-88-1: Drainage area.
GAGE.--Water-stage recorder and crest-stage gage. Datum
of gage is 1,016.52 ft above NGVD of 1929 and 1,016.14 ft above
NAVD of 1988.
REMARKS.--Extensive diurnal fluctuation at low and
medium flow caused by powerplant. Entire flow from 140 mi² of
drainage area controlled by Cranberry Lake (station
04260990).
Water Years 2014-22: Records good except those for estimated
daily discharges, which are poor.
EXTREMES FOR PERIOD OF RECORD.--Maximum discharge, 4,370
ft³/s, Apr. 15, 2014, gage height, 6.45 ft; maximum gage
height, 7.3 ft, Apr. 26, 1926; minimum discharge not
determined.
EXTREMES OUTSIDE PERIOD OF RECORD.--Maximum discharge,
2,850 ft³/s, Jan. 1, 1985, gage height, 6.06 ft, from
floodmark.

 Site Information
 WaterAlert – get an
email or text (SMS) alert based on your chosen threshold.
WaterAlert – get an
email or text (SMS) alert based on your chosen threshold.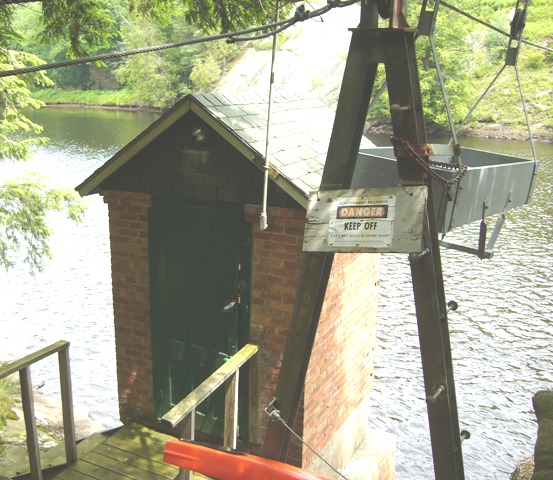 Station image
