LOCATION.--Lat 44°30'35.4", long
74°53'01.0" referenced to North American Datum of
1983, St. Lawrence County, NY, Hydrologic Unit 04150305, on
left bank 300 ft upstream from bridge on State Highway 56 at
South Colton, 500 ft downstream from powerplant, and 0.8 mi
upstream from Cold Brook.
DRAINAGE AREA.--937 mi².
PERIOD OF RECORD.--January 1953 to September 2002,
October 2010 to current year.
REVISIONS HISTORY.--WDR NY-82-1: Drainage area.
GAGE.--Water-stage recorder and crest-stage gage. Datum
of gage is 882.05 ft above NGVD of 1929 and 881.78 ft above
NAVD of 1988.
REMARKS.--Flow regulated 16 mi upstream by Carry Falls
Reservoir since 1953; considerable natural storage in large
lakes upstream from Piercefield. Large diurnal fluctuation
caused by five powerplants upstream from gage.
Water Years 2014-23: Records good except those below 800 ft³/s
and those for estimated daily discharges, which are poor.
EXTREMES FOR PERIOD OF RECORD.--Maximum discharge,
12,800 ft³/s, Apr. 29, 2011, gage height, 11.27 ft; minimum,
1.1 ft³/s, Sept. 10, 2002, gage height, 1.21 ft.

 Site Information
 WaterAlert – get an
email or text (SMS) alert based on your chosen threshold.
WaterAlert – get an
email or text (SMS) alert based on your chosen threshold.
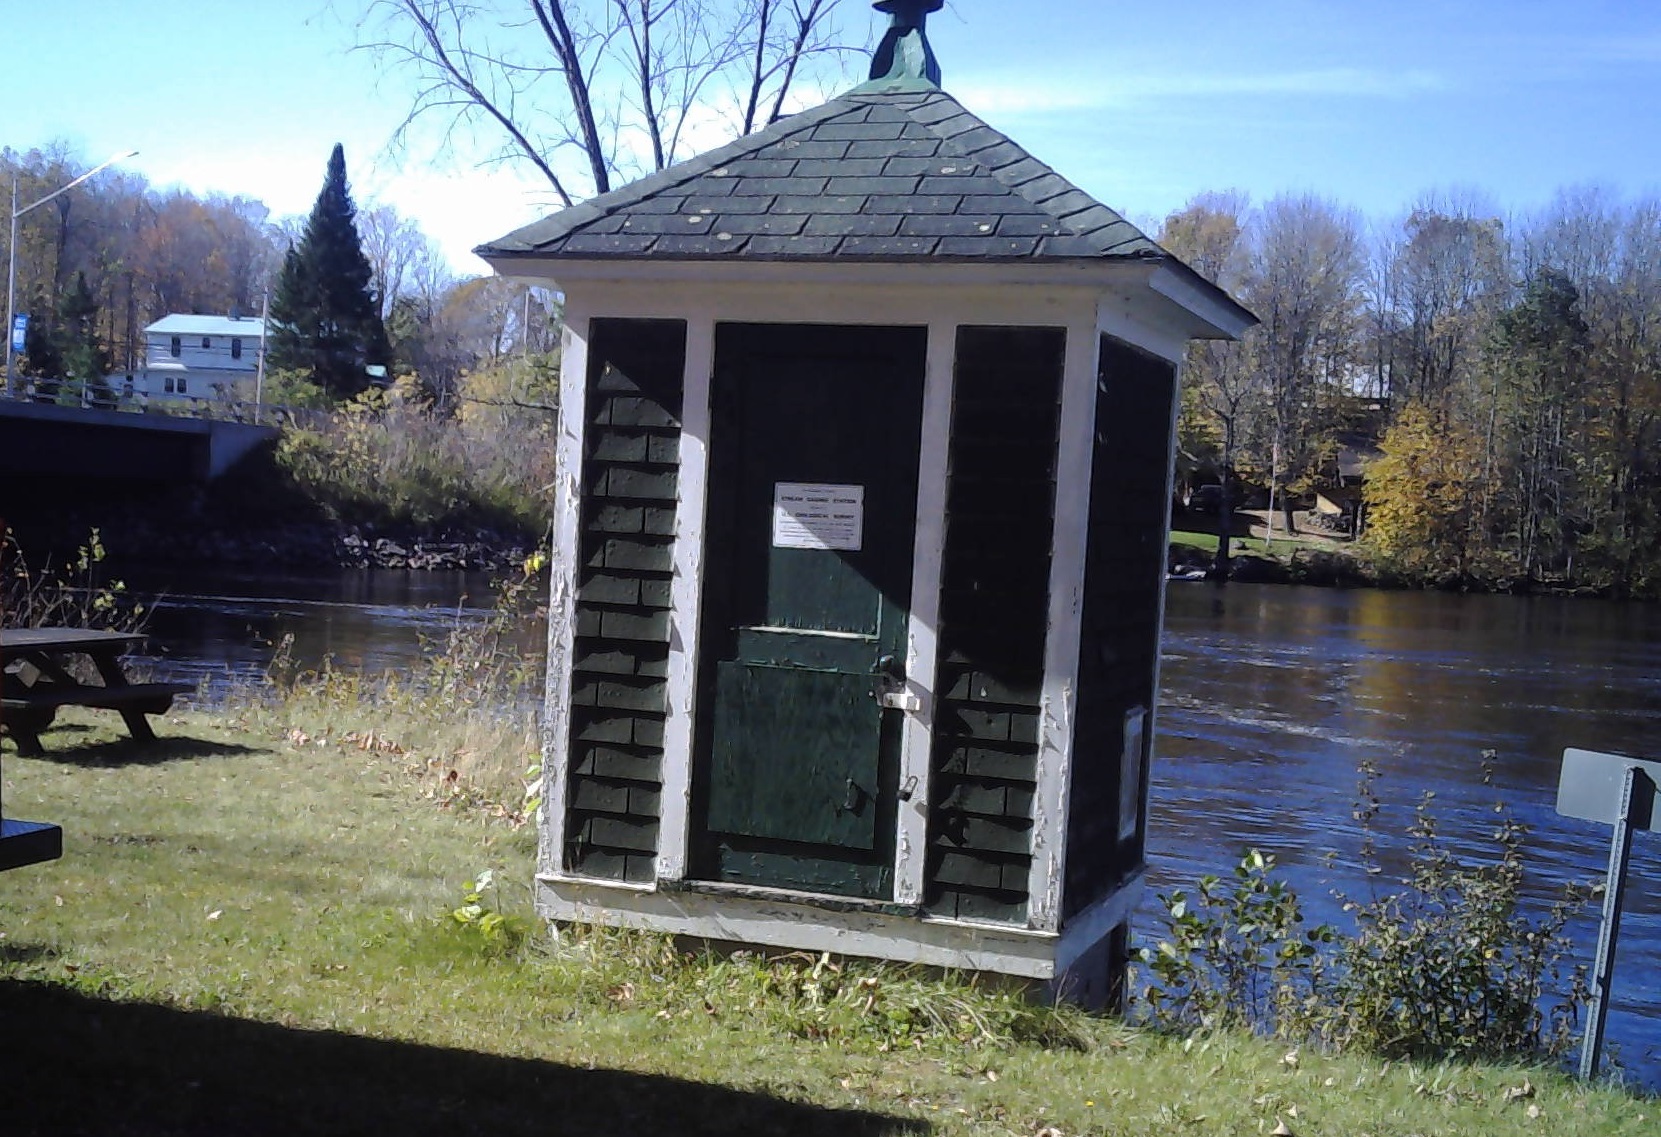 Station image
