Warning: Javascript must be enabled to use all the features on this page!
Page Loading - Please Wait...
- Explore the NEW USGS National Water Dashboard interactive map to access real-time water data from over 13,500 stations nationwide.
-
Full News

Learn more about our modernization plans to find out which options will suit you best. Next Generation Monitoring Location Page is available now.

 WaterNow – get the latest
gage data from your mobile phone or email.
WaterNow – get the latest
gage data from your mobile phone or email.
![Graph of Discharge, cubic feet per second, [Discharge from Primary Sensor]](https://natwebsdww02.cr.usgs.gov/nwisweb/data/img/USGS.06815000.94928.00060..20240424.20240501.log.0.p50.gif)
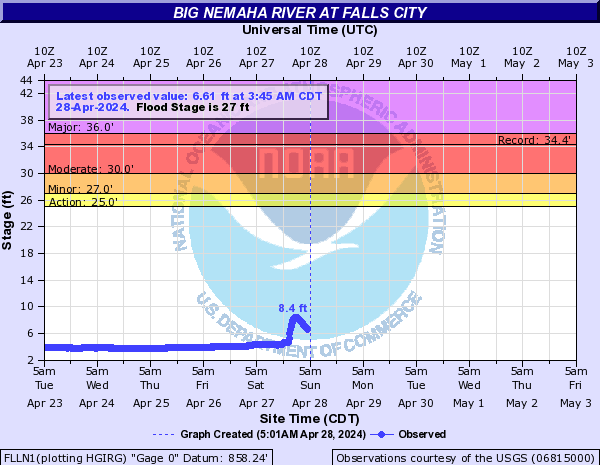
![Graph of Gage height, feet, [Primary Stage Sensor]](https://natwebsdww02.cr.usgs.gov/nwisweb/data/img/USGS.06815000.94929.00065..20240424.20240501..0..gif)