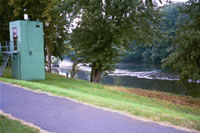
Funding for this site is provided by:
GAGE HAS BEEN
RELOCATED TO THE PENN STREET BRIDGE (Apr 25, 2023). LOW-FLOW GAGE
HEIGHTS WILL BE APPROXIMATELY 1.9 FT HIGHER DUE TO THE CHANGE IN
CONTROL.
 STATION.
--01471510 SCHUYLKILL RIVER AT READING,
PA
LOCATION.--Lat 40`20'07.3", long
75`56'12.6", Berks County, Hydrologic Unit 02040203, on the
downstream side of the Penn Street bridge at Reading, 80 feet from the
left bank, and 1.25 mi downstream from Tulpehocken Creek.
DRAINAGE AREA.--880 square miles.
PERIOD OF RECORD.--May 1914 to September 1915, October
1919 to September 1930 and July 1977 to current year. Prior to October
1914 monthly discharge only, published in WSP 1302. Diversion by
Schuylkill Navigation Canal included during the navigation seasons of
1914-15.
GAGE.--Water-stage recorder, crest-stage gage, and
water quality monitor. Datum of gage is 184.71 ft above North American
Vertical Datum of 1988 (from benchmark). May 7, 1914, to Sept. 30,
1930, and July 6, 1979, to Dec. 5, 1980, non-recording gage. June 30,
1977, to July 5, 1979, water-stage recorder at site 2,800 ft downstream
on right bank at same datum. July 5, 1979 to Aug 30, 2018, water-stage
recorder at site 1,300 ft downstream on left bank at same datum. Aug
30, 2018 to Apr 25, 2023, water-stage recorder at site 2,700 ft
downstream on trail bridge at same datum. Prior to February 19, 2025,
the datum of gage was reported as 185.50 ft above National Geodetic
Vertical Datum of 1929. Satellite telemetry at station.
COOPERATION.--Funding for the operation of this
station is provided by the U.S. Army Corps of Engineers, Philadelphia
District.
REMARKS.--Flow regulated by Still Creek Reservoir
(station 01469200) since February 1933, Blue Marsh Lake (station
01470870) since April 1979, and to some extent by Lake Ontelaunee.
| The 30-minute precipitation data for this station are
temporary and will only be displayed for 120 days. Time series
of 1-hour or cumulative daily values will NOT be available for
retrieval following the 120-day display period. Although the
instrumentation is calibrated at least once a year, the temporary
classification means that documented routine inspections and other
quality assurance measures are not performed that would make the
data acceptable for archival, retrieval, or future use in general
scientific or interpretive studies. |
GAGE HEIGHTS OF IMPORTANCE.-
Supplied by USGS: Data transmitter operational limit -
53.0 ft;
Supplied by NWS: Action stage-14.5 ft; Flood
stage-15.5 ft, flooding begins in Reading, portions of Water and Canal
Streets are flooded; Moderate flood stage-18 ft, additional streets in
Reading are closed; West Reading begins to see street flooding; Reading
Conrail tracks flood; Major flood stage-22 ft, more roads in Reading
flood, including the East and West bound lanes of US 222/422 (West
Shore Bypass); Conrail tracks in West Reading are inundated.
![[!]](https://pa.water.usgs.gov/images/exclaim.gif) Over the
next year, the USGS Pennsylvania Water Science Center will be updating
the geodetic vertical elevation (gage datum) for many locations. Click
HERE for additional information including a current list of
streamgages with upcoming datum changes. This update in gage datum does
not affect the location of the streamgage, nor the observed local gage
height or discharge recorded at the streamgage.
Over the
next year, the USGS Pennsylvania Water Science Center will be updating
the geodetic vertical elevation (gage datum) for many locations. Click
HERE for additional information including a current list of
streamgages with upcoming datum changes. This update in gage datum does
not affect the location of the streamgage, nor the observed local gage
height or discharge recorded at the streamgage. STATION.--01471510 SCHUYLKILL RIVER AT READING,
PA


