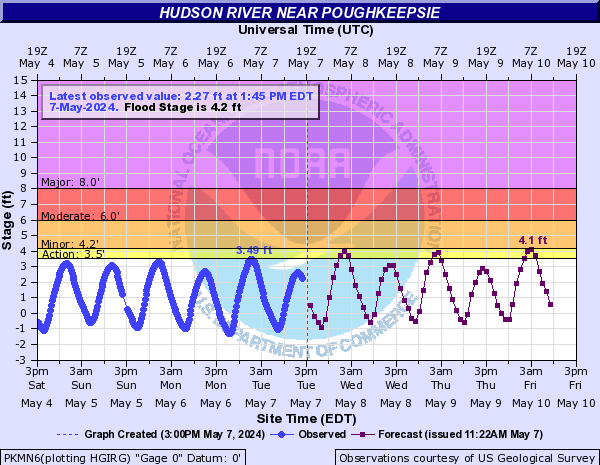
PROVISIONAL DATA SUBJECT TO REVISION
 Site Information
DRAINAGE AREA.--11,833 mi².
PERIOD OF RECORD.--October 2012 to current year.
REVISIONS HISTORY.--Drainage area was revised on Aug. 30, 2023, from 11,700 sq mi to 11,833 sq mi, based on better definition methods.
GAGE.--Water-stage recorder. Datum of gage is NGVD of 1929. To convert elevations to NAVD of 1988, subtract 0.86 ft.
REMARKS.--Elevations are not corrected for changes in water density. Blanks in tables are the result of only one high or low tide during a day or interruption of record.
EXTREMES FOR PERIOD OF RECORD.--Maximum elevation, 9.91 ft, Oct. 30, 2012; minimum elevation, about -3.90 ft, Jan. 6, 2018.
PERIOD OF RECORD1.--
CHEMICAL DATA: 1969 (c), 1970-71 (d), 1972 (b), 1973 (e),
1974-75 (d), 1988 (a), 1989-90 (b), 1991 (c), 1992 (a), 1993
(c),
1994 (d), 1995 (c), 1996 (a), 2010-13 (d).
MINOR ELEMENTS DATA: 1969 (c), 1970-71 (d), 1972 (b), 1973-75
(d), 1988 (a), 1989-90 (b), 1991 (c), 1992 (a).
RADIOCHEMICAL DATA: 1974 (a), 1975 (d).
PESTICIDE DATA: 1993-94, 1996 (a), 2010-13 (d).
ORGANIC DATA: OC--1974 (b), 1975 (d), 1993 (c), 1994 (d), 1995
(c), 1999-2000 (e), 2010-13 (d). PCB--1993 (a). PCN--1993
(a).
NUTRIENT DATA: 1969 (c), 1970-71 (d), 1972 (b), 1973-75 (d),
1993 (c), 1994 (d), 1995 (c), 2010-13 (d).
BIOLOGICAL DATA: Bacteria--1973 (c), 1974-75 (d).
Phytoplankton--1973 (a), 1974 (b), 1975 (d), 1993 (a).
Periphyton--1974 (c), 1975 (a).
SEDIMENT DATA: 1973 (a), 1974 (b), 1975 (a), 1989-90 (b), 1991
(c), 1992 (a), 1993 (c), 1994 (d), 1995 (c), 1999-2000 (e),
2010 (e), 2011-13 (d).
October 1959 to September 1966, October 1972 to September 1975, April 2019 to current year.
PERIOD OF DAILY RECORD1.--WATER TEMPERATURE: October 1959 to September 1966, October 1972 to September 1975. WATER TEMPERATURE [HRECOS] AT PUMP: November 2019 to January 2021. WATER TEMPERATURE [HRECOS] AT SURFACE: April 2019 to current year.
SPECIFIC CONDUCTANCE [HRECOS] AT PUMP: November 2019 to January 2021. SPECIFIC CONDUCTANCE [HRECOS] AT SURFACE: April 2019 to current year.
pH [HRECOS] AT PUMP: November 2019 to January 2021. pH [HRECOS] AT SURFACE: April 2019 to current year.
DISSOLVED OXYGEN [HRECOS] AT SURFACE: April 2019 to current year.
TURBIDITY [HRECOS] AT PUMP: November 2019 to January 2021. TURBIDITY [HRECOS] AT SURFACE: April 2019 to current year.
INSTRUMENTATION1.--[HRECOS] AT PUMP: A multi-parameter water-quality sonde measures water temperature, specific conductance, pH, and turbidity at 15-minute intervals from November 2019 to January 2021.
[HRECOS] AT SURFACE: A multi-parameter water-quality sonde measures water temperature, specific conductance, pH, dissolved oxygen, and turbidity at 15-minute intervals since April 2019.
REMARKS1.--Daily water-temperature measurements were made at approximately 0830 during water years 1960-63 and at approximately 0700 during water years 1964-66. Daily water-temperature measurements were made between 0800 and 0830 during water years 1973-75, furnished by City of Poughkeepsie, Water Department. Temperature readings during water years 1960-63, 1973-75 were originally published rounded to the nearest 0.5°C.
COOPERATION1.--April 2019 to current year: Maintained by the Hudson River Environmental Conditions Observing System in cooperation with Marist College and the Cary Institute of Ecosystem Studies.
EXTREMES FOR PERIOD OF DAILY RECORD1.--WATER TEMPERATURE (water years 1960-66, 1973-75): Maximum daily, 27.0°C, Aug. 5, 1975; minimum daily, 0.0°C, Dec. 26-28, 1974. WATER TEMPERATURE [HRECOS] AT PUMP: Maximum, 30.0°C, Aug. 11, 2020; minimum, 1.6°C, on several days during winter periods. WATER TEMPERATURE [HRECOS] AT SURFACE: Maximum, 28.0°C, on several days during summer 2019 period; minimum -0.1°C, on many days during 2021 winter period.
SPECIFIC CONDUCTANCE [HRECOS] AT PUMP: Maximum, 1,220 uS/cm @ 25°C, Sept. 30, 2020, minimum, 112 uS/cm @ 25°C, Nov. 6, 2019. SPECIFIC CONDUCTANCE [HRECOS] AT SURFACE: Maximum, 454 uS/cm @ 25°C, Mar. 5, 2021; minimum, 153 uS/cm @ 25°C, Apr. 28, 29, 2019.
pH [HRECOS] AT PUMP: Maximum, 8.3, on several days in Jan. 2021; minimum, 6.6, on several days in June and July 2020. pH [HRECOS] AT SURFACE: Maximum, 8.6, May 25, 2019; minimum, 7.0, July 29, 30, 31, 2019.
DISSOLVED OXYGEN [HRECOS] AT SURFACE: Maximum, 15.1mg/L, Dec. 31, 2019, January 1, 2020, Jan. 29, 2021; minimum, 3.9 mg/L, July 27, 2019.
TURBIDITY [HRECOS] AT PUMP: Maximum, 21.7 FNU, Nov. 12, Dec. 16, 2020; minimum, <0.3 FNU, Jan. 22, 2021. [<, actual value is known to be less than the value shown].
1 Water-Quality Records
Summary of all available data for this site
Instantaneous-data availability statement
 WaterAlert – get an
email or text (SMS) alert based on your chosen threshold.
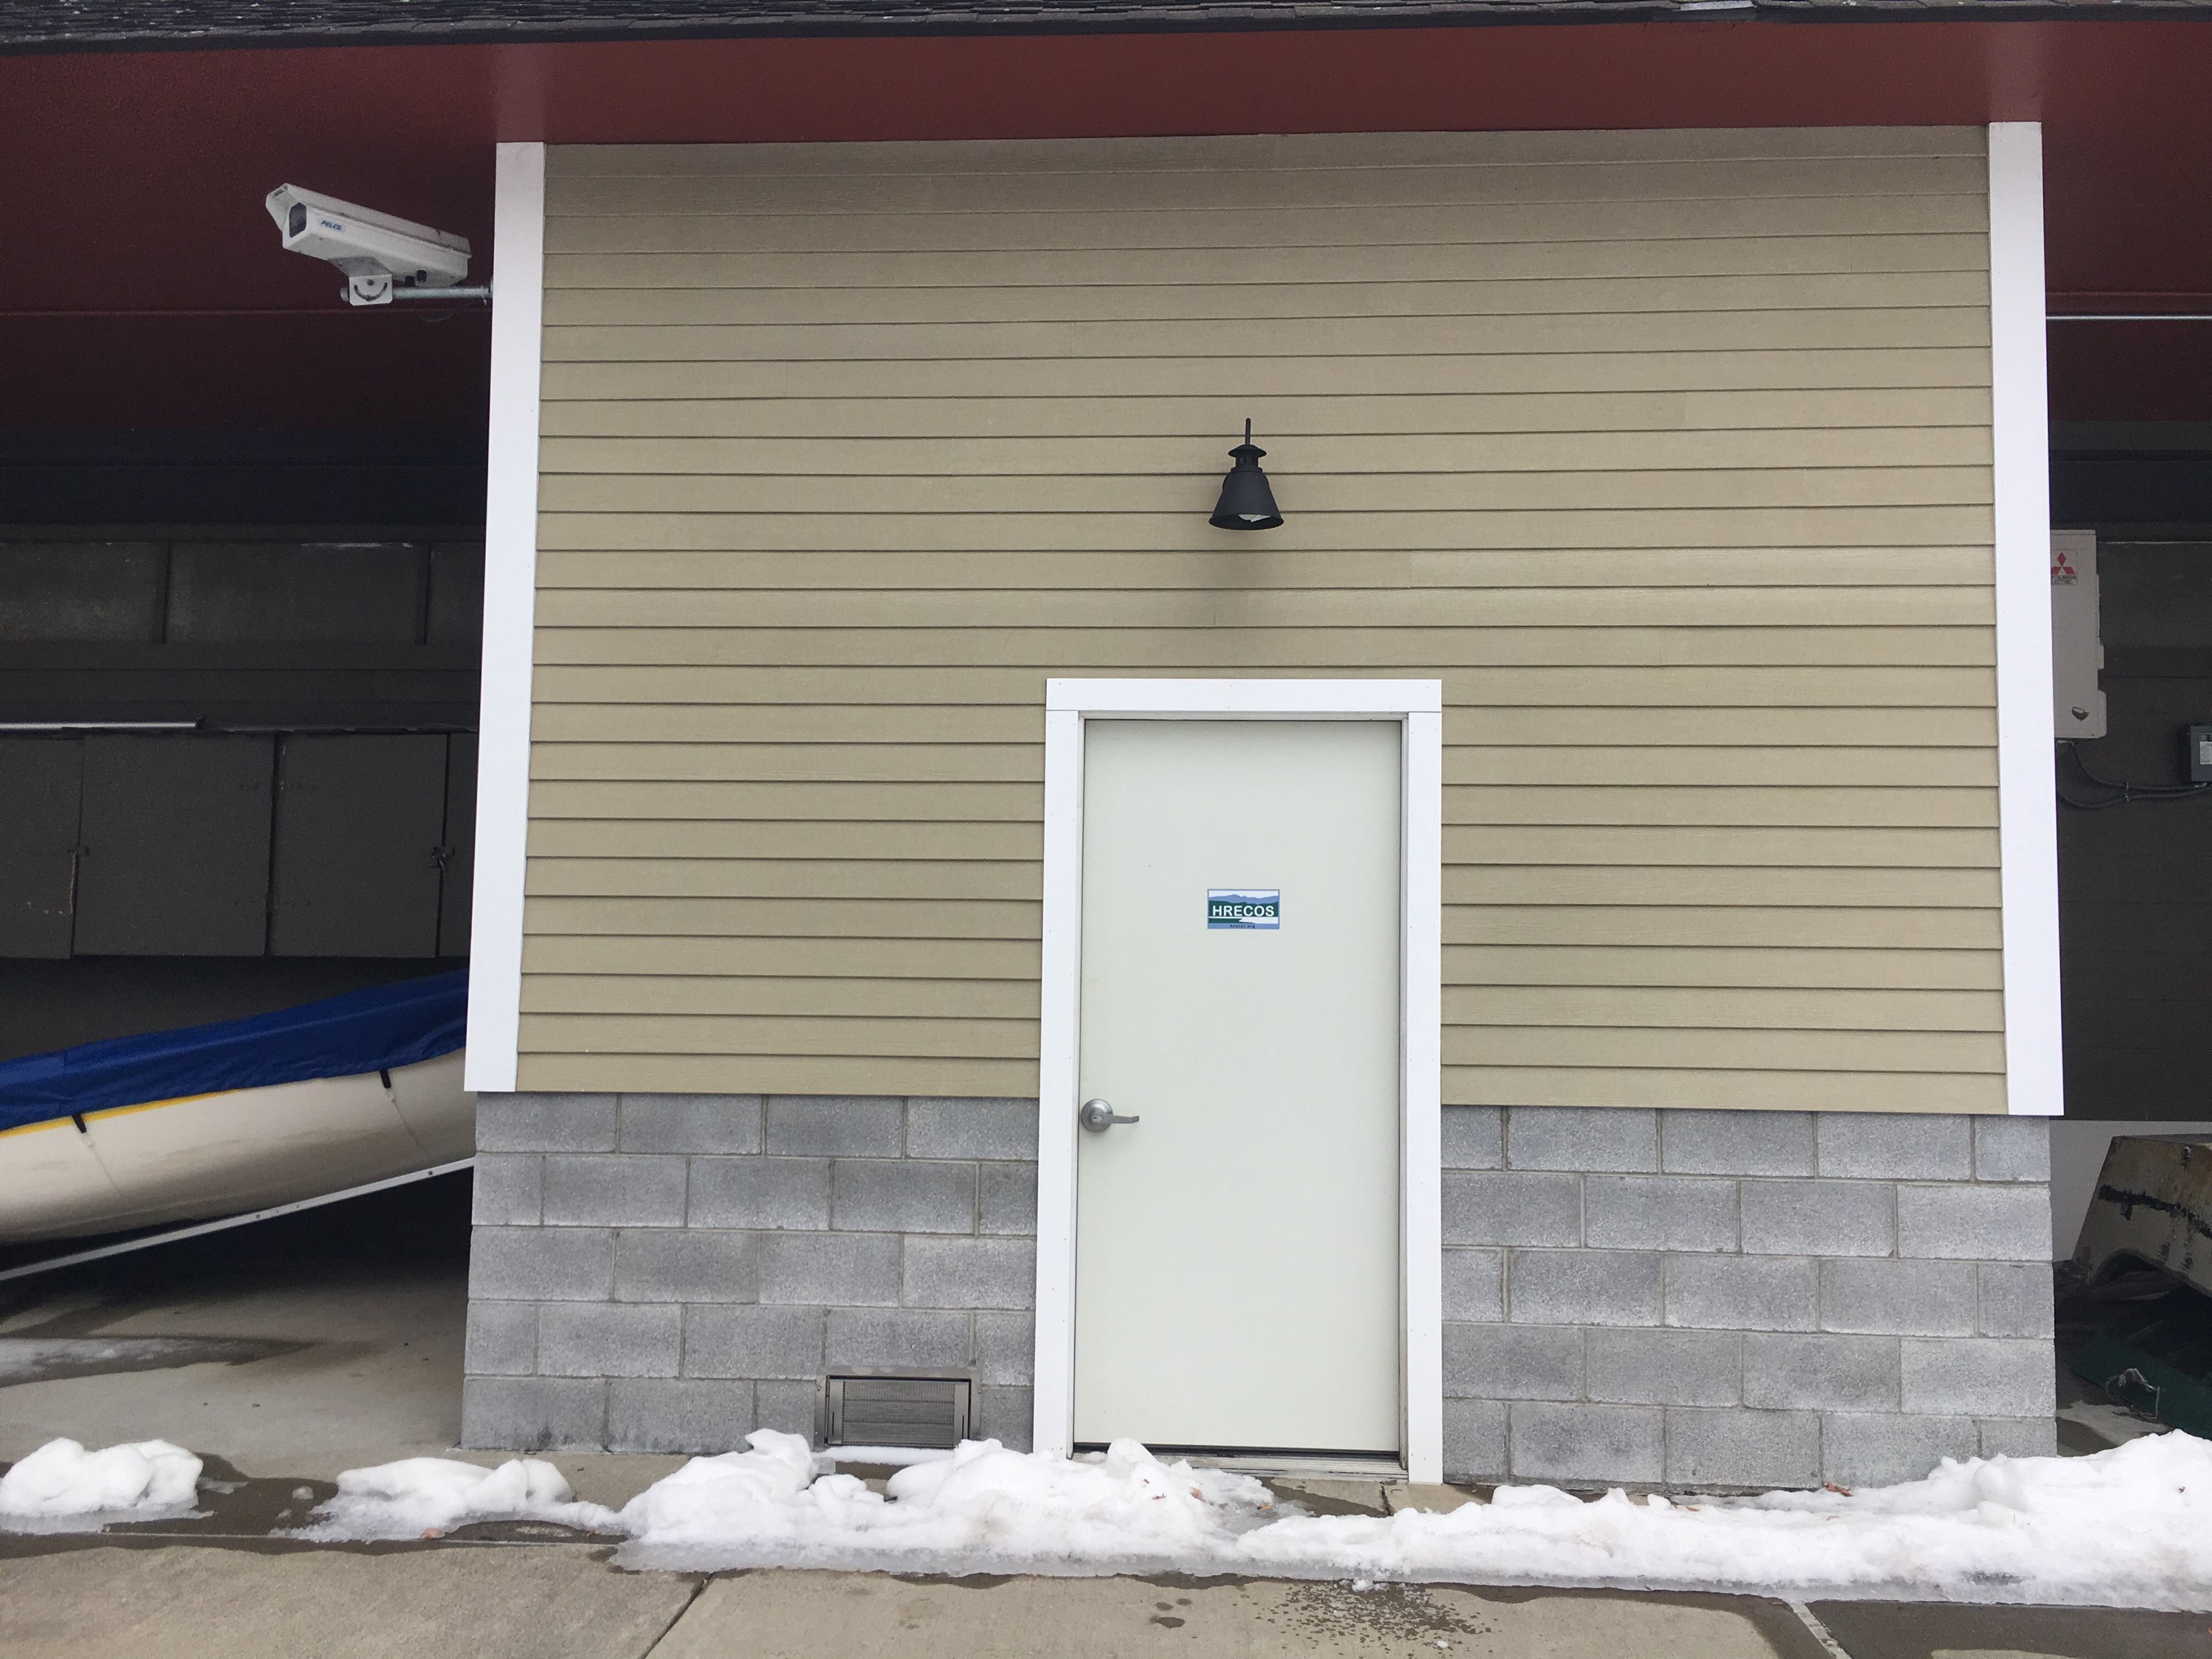
 Station image

