LOCATION.--Lat 42°07'01", long
74°22'49" referenced to North American Datum of 1983,
Ulster County, NY, Hydrologic Unit 02020006, on right bank 20
ft downstream from bridge on Fox Hollow Road, 200 ft downstream
from Fox Hollow Creek, 600 ft upstream from Peck Hollow Creek,
at Allaben.
DRAINAGE AREA.--63.7 mi².
PERIOD OF RECORD.--Occasional low-flow and/or
miscellaneous discharge measurements, water years 1941,
1956-61. October 1963 to current year. Prior to October 1988,
published as "at Shandaken" (01362198).
GAGE.--Water-stage recorder and crest-stage gage. Datum
of gage is 998.04 ft above NGVD of 1929 and 996.98 ft above
NAVD of 1988. Prior to Nov. 22, 1988, at site 0.5 mi upstream
at datum 19.23 ft higher.
REMARKS.--Occasional slight regulation when filling or
draining swimming pools or small ponds upstream from
station.
Water Years 2014-18, 2020-21: Records good except those for
estimated daily discharges, which are poor. Water Years 2019,
2022-24: Records fair except those for estimated daily
discharges, which are poor.
EXTREMES FOR PERIOD OF RECORD.--Maximum discharge,
29,300 ft³/s, Aug. 28, 2011, gage height, 16.34 ft, from rating
curve extended above 3,700 ft³/s, on basis of runoff comparison
of peak flows from contracted-opening measurements at gage
heights 14.44 ft and 16.34 ft at site 1.0 mi upstream; minimum
discharge, 2.1 ft³/s, Sept. 16, 1983 (result of slight
regulation upstream from station).
EXTREMES OUTSIDE PERIOD OF RECORD.--Flood of Mar. 30,
1951 reached a stage of about 15.1 ft, at previous site and
datum, from information supplied by local residents, discharge
about 20,000 ft³/s, on basis of slope-area measurement of peak
flow.
 Site Information
 WaterAlert – get an
email or text (SMS) alert based on your chosen threshold.
WaterAlert – get an
email or text (SMS) alert based on your chosen threshold.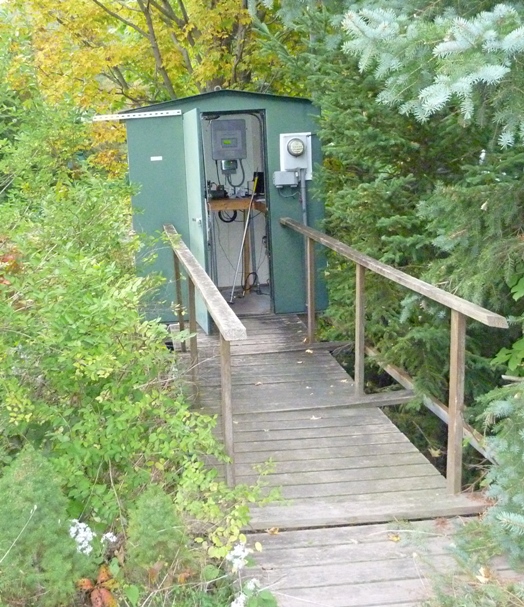 Station image


![Graph of Turbidity, water, unfiltered, monochrome near infra-red LED light, 780-900 nm, detection angle 90 +-2.5 degrees, formazin nephelometric units (FNU), [Observator, Analite NEP 5000 S]](https://natwebsdww01.cr.usgs.gov/nwisweb/data/img/USGS.01362200.335410.63680..20260707.20260714..0..gif)

