
Water Data Science in 2021
Where data science in USGS is headed in 2021
Where the USGS Water Data Science Branch is headed in 2021
It is an exciting time to be a data science practitioner in environmental science. In the last five years, we’ve seen massive data growth, modeling improvements, new more inclusive definitions of “impact” in science, and new jobs and duties. The title of “data scientist” has even been formally added as a job role by the federal government and there are all kinds of data science needs spelled out in the new USGS science plan .
As 2021 progresses, I felt compelled to write up a few of the activities we are focusing on right now, as well as share some ideas we are exploring for the future. If you want to jump ahead, I’ve included links below to four areas of emphasis our Data Science Branch has this year.
A renewed focus on water data visualizations
Advancing machine learning architectures for water prediction
Forecasting changes to water resources
Collaborative, reproducible, and efficient data workflows
First, some background
We formally started a data science team in 2014, and this team was converted into the organizational unit of “Data Science Branch” in the USGS Water Resources Mission Area in late 2017. The scope of this team/branch has evolved over the years but has always included elements of data analysis and prediction, data visualization, reproducibility, and data science training. We’ve also continued to be motivated by solving problems related to data complexity and data volume, and how we can integrate new data science concepts into more traditional fields like hydrology, ecology, and limnology.
We work for the US Federal Government where change is often slow, but we were able to establish the first formal data science group in the U.S. Geological Survey and continue to benefit from leadership support of this capability. At the same time, what we do and how we do it is pretty different from the way the USGS has operated in the past. Having entire jobs devoted to data visualization or having staff spend the necessary time to make complex data workflows fully reproducible are two examples that have required years of demonstrated usefulness to gain general acceptance. And although machine learning is the main toolset for prediction in many sectors, environmental science has continued to make primary modeling investments in process-based approaches that build on existing knowledge. We’ve been making progress bridging these modeling approaches by combining them, generating deep learning predictions that are guided by existing theory and are more accurate than either approach alone.
Ok…enough of my rambling and onto the fun stuff.
A renewed focus on water data visualizations
U.S.Geological Survey’s VIZLAB (credit E Bechtel)
In 2021 we are stepping up our data visualization game. Step one was hiring Cee and Ellen to join the team as full-time visualization specialists, as well as Hayley, who does viz, modeling, and workflows. Next, we’re holding ourselves to the goal of greater output of high-quality data visualizations. We first started experimenting with data visualization in 2014, visualizing the drought conditions in California with a mix of tech that included d3.js and thoughtful visual design and started using the banner of USGS “Vizlab” (visualization laboratory), going on to release a number of data visualizations on water topics including microplastics in our waterways , climate change and freshwater fish , and U.S. water use . We also have tested different ways to communicate the complexity of flood timing during hurricane events, using both interactive and GIFs/videos that were rendered shortly after landfall. But we’re making a major leap this year with the way we produce visualizations and we’ve upped our standards for design. Check out water sci and mgmt in the Delware , gages through the ages , and fire hydro for a view into early progress. We’re even working on a dataviz that explains how process-guided deep learning models make more accurate predictions (more on that below ). I’m excited to see what’s next.
Advancing machine learning architectures for water prediction
An animation of of a process-guided deep learning model predicting stream water temperature. (credit H Corson-Dosch)
There is swirling mix of excitement, fear, misunderstanding, and raw wonder concerning the role of machine learning in water prediction. In the Data Science branch, we’re excited about the potential use of ML in all kinds of USGS projects. But being part of the USGS, we also understand the positive modeling legacy our agency has, which could be tarnished by misuse or blind adoption of ML. A lot of the fear surrounding ML in environmental sciences comes from a combination of how well it seems to perform in prediction and how seemingly effortless it is to apply ML to the problem du jour seems to be. There is a lot of nuance to each of these assumptions, as we rarely have enough data to build a truly generalizable environmental ML model, and while these models may be faster to spin up, major challenges exist for dealing with data sparsity, estimating uncertainty, and applying knowledge-based constraints that require custom architectures and cutting-edge research. We have partnerships with the Kumar lab at U-MN, the Jia lab at Pitt, and the Shen lab at Penn State to collaborate on the exciting field of "Knowledge Guided Machine Learning".
Forecasting changes to water resources
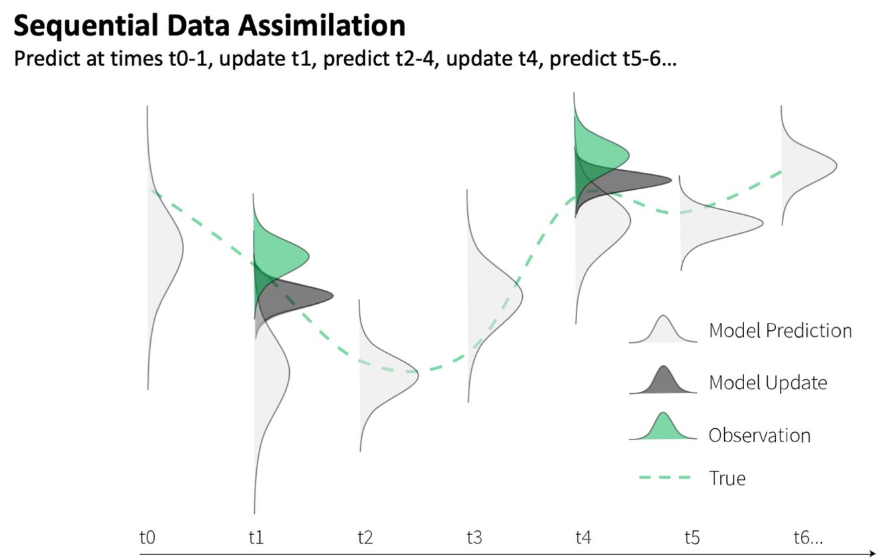
Sequential data assimilation forecasting (credit J Zwart).
Continuing on with the theme of building better predictions with data, we are leading a new project to forecast stream and reservoir temperatures in the Delaware River Basin using data assimilation and machine learning. Data assimilation (DA) is a technique that makes iterative improvements to forecasts by weighting the confidence in new observations (e.g. streamflow and water temperature) with the confidence in model predictions. These improvements or adjustments can include changes to parameters and/or state variables that are internal to the model. DA is an especially powerful tool for environmental forecasts because it can take advantage of the continued accumulation of data to improve predictions and leverage real-time observations for updates, such as those from the thousands of USGS gages that pepper the landscape.
This technique is clearly data-intensive and requires thoughtful automation to perform in a forecast setting. We are able to leverage several of the other Data Science capabilities to strengthen his effort, such as reproducible workflows and data visualization. Jake is currently working on integrating DA with machine learning in this project. Forecasting is relatively new but important territory for USGS, and we’re very pleased to be part of leading the simultaneous growth in forecasting and DA in the Water Resources Mission Area.Capturing reproducible and efficient data workflows
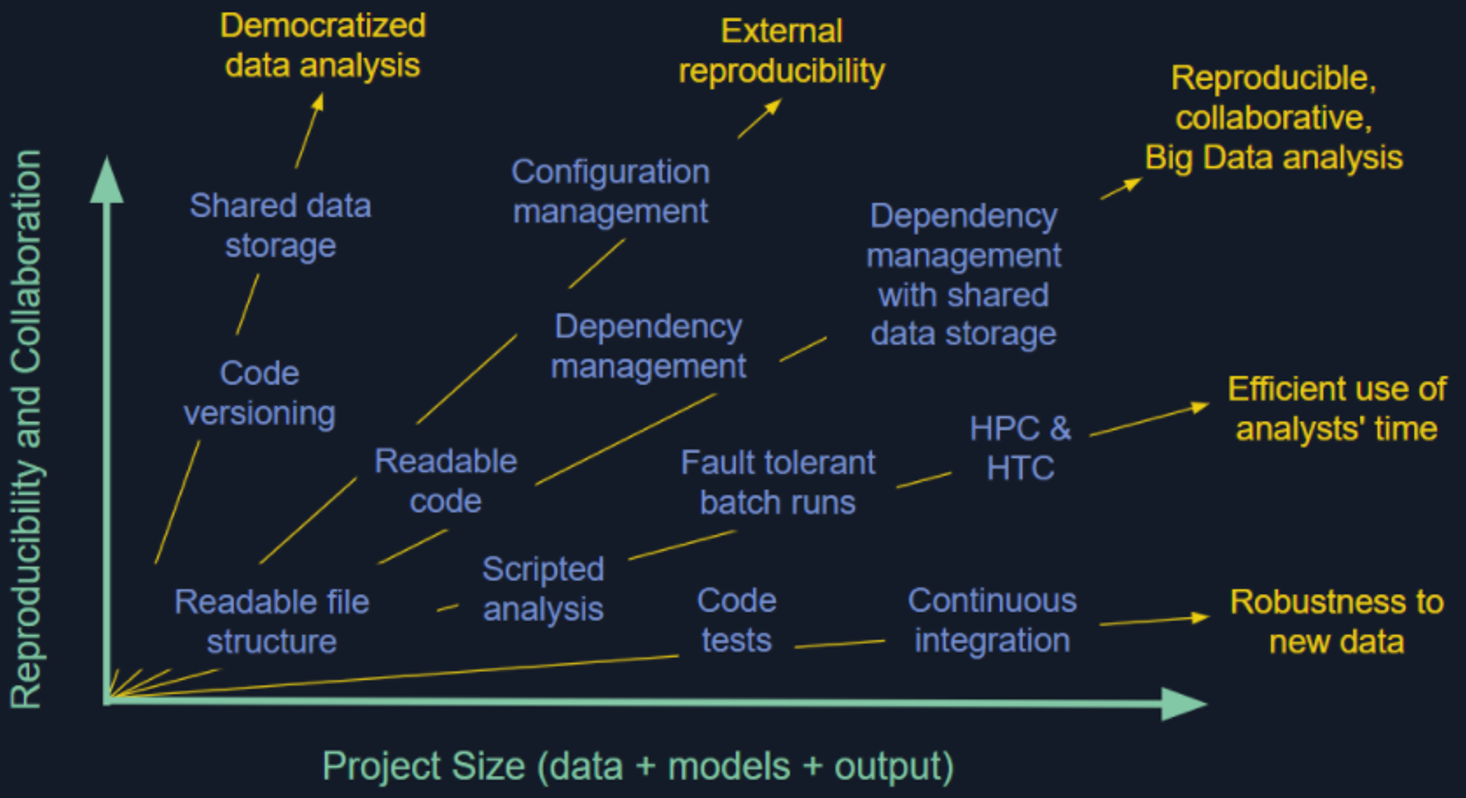
Reproducibility spectrum (credit A Appling)
Reproducibility is a crisis in some research fields and is only getting harder as science becomes larger, more collaborative, more data-intensive, and more integrated across a greater number of disciplines. We’re repro-nerds and think it is a tough ask to trust results or findings that aren’t backed by a transparent and repeatable workflow, so we emphasize doing so in all aspects of our work. A lot of researchers can get by without investing too much in reproducibility, but it seems inevitable that this strategy will either result in embarrassment or be a blocker to implementing the next logical approach. Worse, an entire research community that undervalues reproducibility may stunt the growth of the field – for example – accepting the status quo of single numeric predictions instead of expecting more useful results that explicitly quantify uncertainty (but which require workflows due to numerous iterations). Each of our data visualizations includes a GitHub repository that exposes all of the code used to build it, including how we fetched, transformed, and visualized the data. We have large-scale data pipelines for building model-ready data that can be updated quickly, and similar workflows for analyzing traffic to USGS Water websites (new hire Rasha is working on both). We’ve built some of our own tools to do this that use a make-like tracking of data and code dependencies, so that running the whole processing/modeling workflow only runs steps that have upstream data/code that are out of date, while still ensuring that the entire workflow could be run from scratch if needed.
It’s an exciting time and we like what we’re doing! Contact us to discuss, collaborate, or even join our team. You can follow @USGS_DataSci on twitter to stay up to date. We’ll be hiring ~4 people this year alone and are on the lookout for people who would be energized to be part of this team.
Related Posts
USGS water data science in 2022
September 3, 2022
The USGS water data science branch in 2022
The USGS data science branch advances environmental sciences and water information delivery with data-intensive modeling, data workflows, visualizations, and analytics. A short summary of our history can be found in a prior blog post . Sometimes I refer to data scientists as experts in wrangling complex data and making it more valuable or usable. I’m writing this blog to update readers on the types of things we’re up to and point out some future changes (including new hiring efforts).
What is the USGS Vizlab?
November 10, 2021
The USGS Vizlab is a collaborative team that uses data visualization to communicate water science and data to non-technical audiences. Our mission is to create timely visualizations that distill complex scientific concepts and datasets into compelling charts, maps, and graphics. We operate at the intersection of data science and science communication. To get a sense of our work you can check out our new portfolio site.
Large Data Pulls from Water Quality Portal - A Pipeline-Based Approach
September 27, 2022
Background
The Water Quality Portal (WQP ) database aggregates and standardizes discrete water quality data from numerous federal, state, tribal, and other monitoring agencies. The WQP enables the access and retrieval of over 297,000,000 water quality records (Read et al. 2017) through web services and an application programming interface (API) that can be called programmatically using the
dataRetrievalpackage in R. Downloading data from the WQP represents a common pattern across USGS data teams.How we work on the Water Data for the Nation Team
March 9, 2021
The USGS Water Mission Area (WMA) is the largest provider of real time and historical water information in the world. A major part of our work in the WMA Web Communications Branch is to build modern web applications and APIs to make these data publicly available. We call our data delivery product line Water Data for the Nation (WDFN). Here’s our product vision:
Recreating the U.S. River Conditions animations in R
March 29, 2021
For the last few years, we have released quarterly animations of streamflow conditions at all active USGS streamflow sites . These visualizations use daily streamflow measurements pulled from the USGS National Water Information System (NWIS) to show how streamflow changes throughout the year and highlight the reasons behind some hydrologic patterns. Here, I walk through the steps to recreate a similar version in R.