
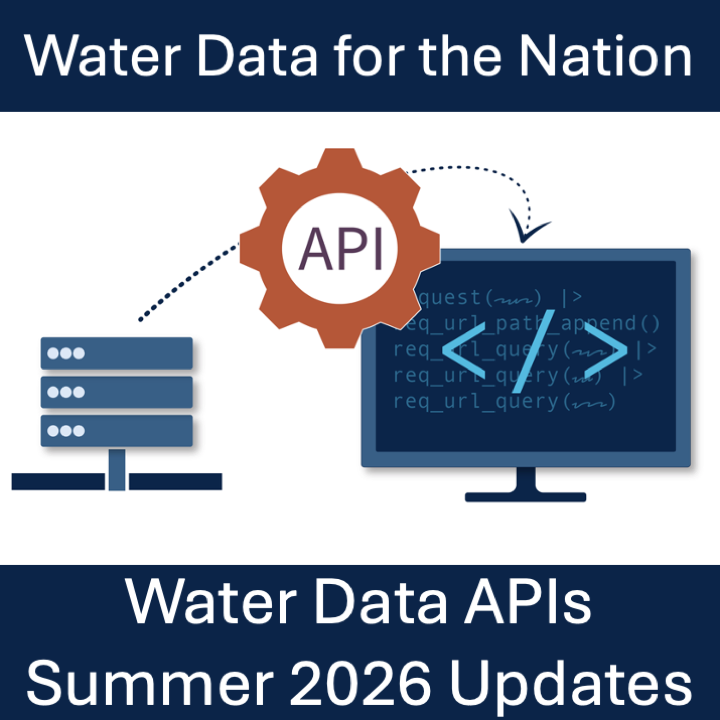
A new endpoint for peak flows is now available, queries now have additional metadata fields for filtering, and a new UI theme has been released for HTML responses.
Official websites use .gov
A .gov website belongs to an official government organization in the
United States.
Secure .gov websites use HTTPS
A lock (
) or https:// means you’ve safely connected to the .gov website. Share
sensitive information only on official, secure websites.
A new endpoint for peak flows is now available, queries now have additional metadata fields for filtering, and a new UI theme has been released for HTML responses.
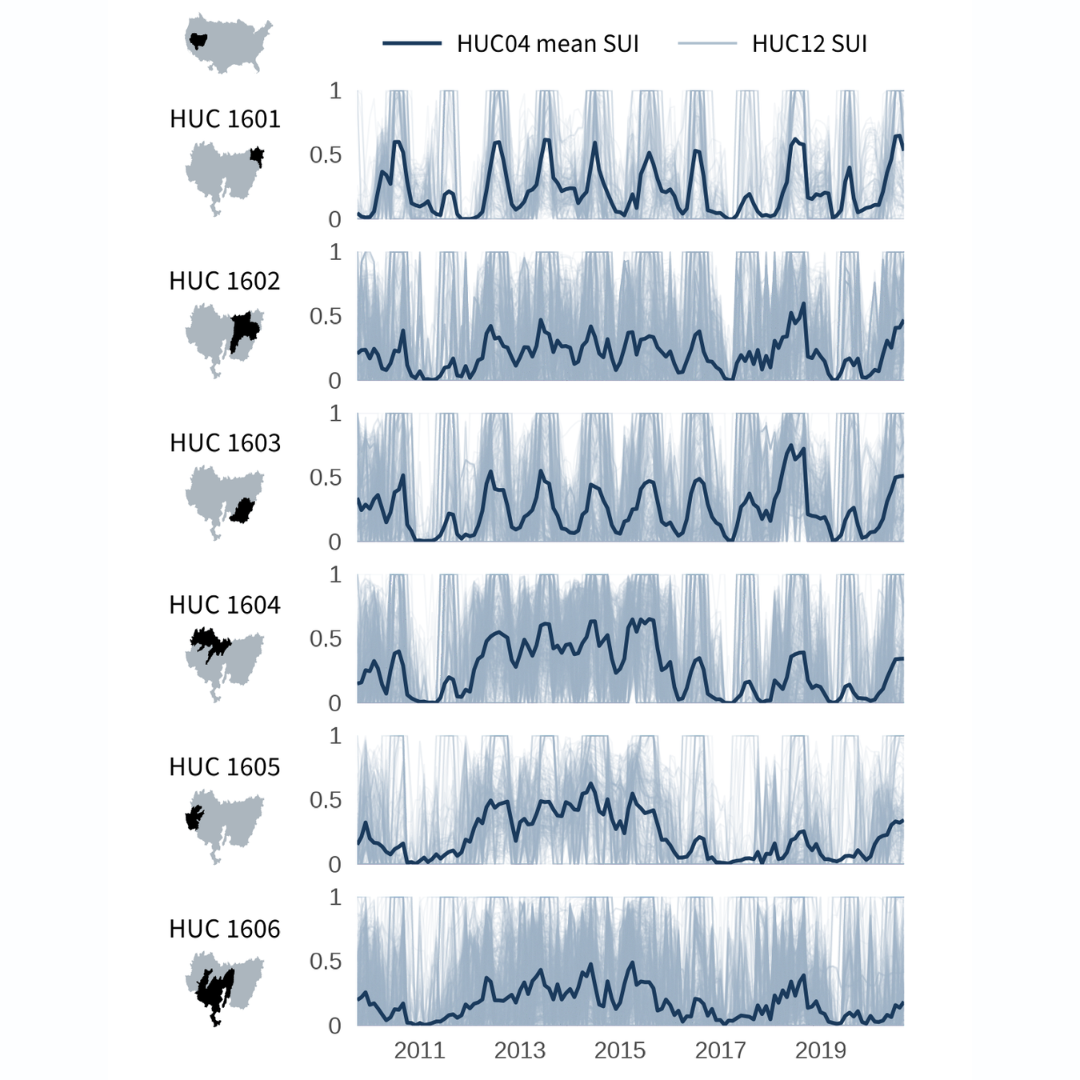
The National Water Availability Assessment Data Companion (NWDC) provides nationally-consistent modeled water data, including the surface water supply and use index (SUI), which is an indication of water limitation across the lower 48 United States. In this blog, we demonstrate how to programmatically download data from the Data Companion using R and API web services, process the data for mapping, and create customized data visualizations.
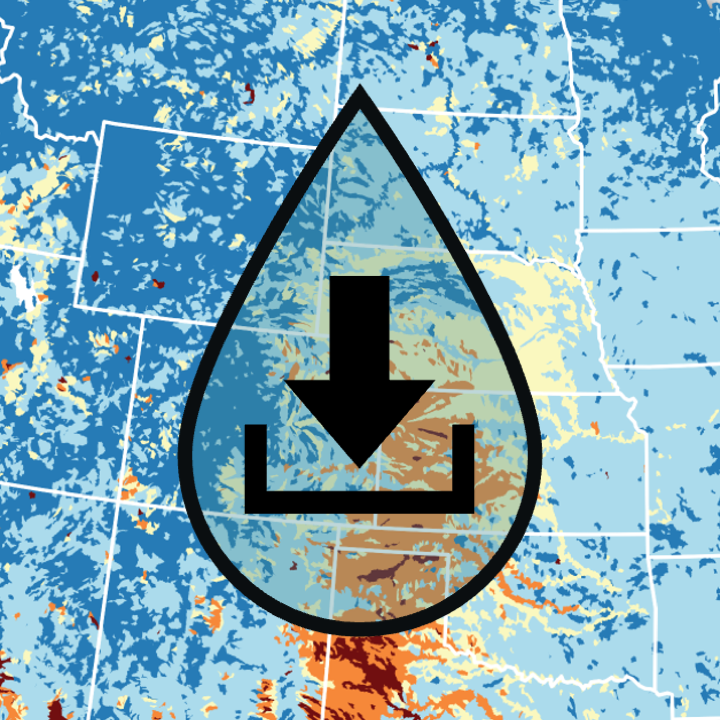
The National Water Availability Assessment Data Companion provides a centralized source for national water availability data, including quantity, quality, and use across approximately 80,000 sub-watersheds nationwide.
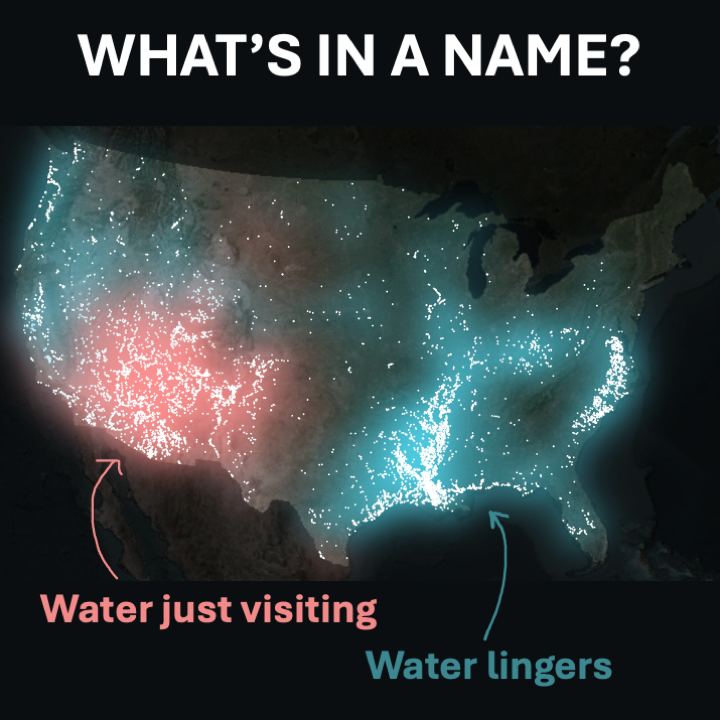
Building firefly-style maps in R to see patterns in stream names across United States.
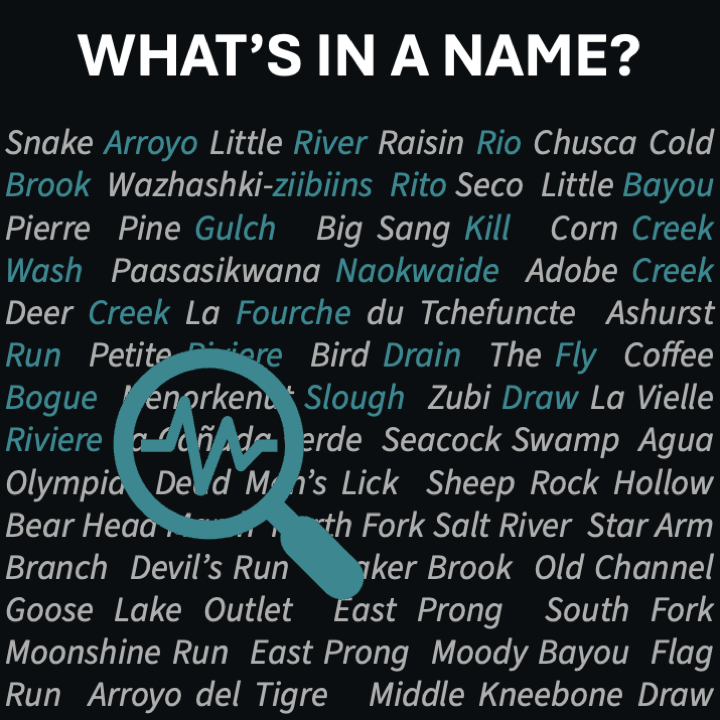
Building a reproducible system for identifying the generic feature words from stream names using R.
Plotting hydrography data has never been easier with the latest versions of nhdplusTools and ggplot2. This blog demonstrates how to fetch and map National Hydrography Dataset (NHD) rivers and waterbodies with several reproducible examples.
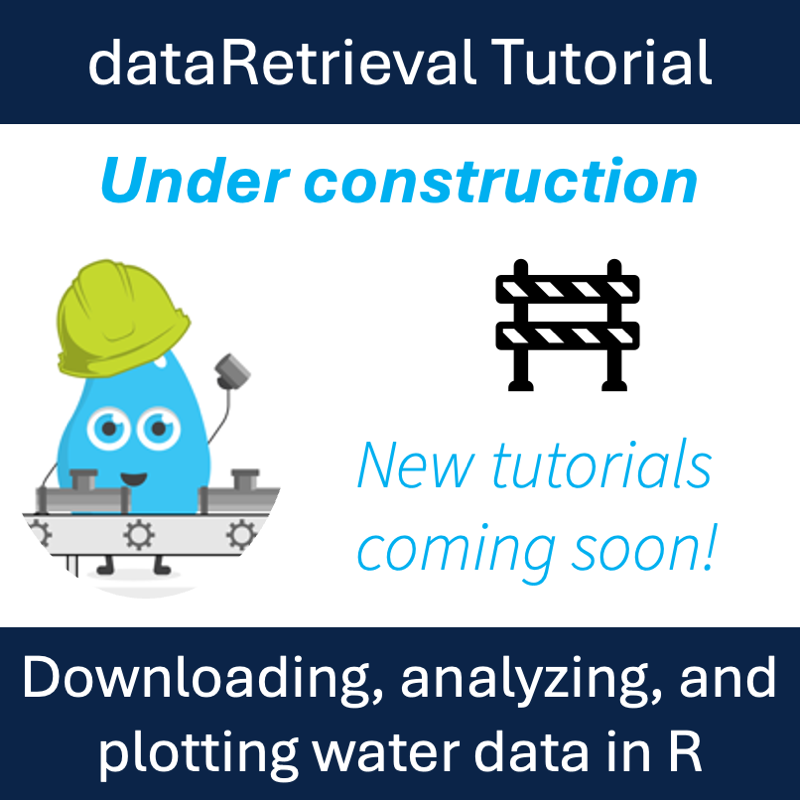
This is a basic dataRetrieval tutorial for USGS water data in R in which we highlight new functionality for dataRetrieval and the new Water Data APIs.
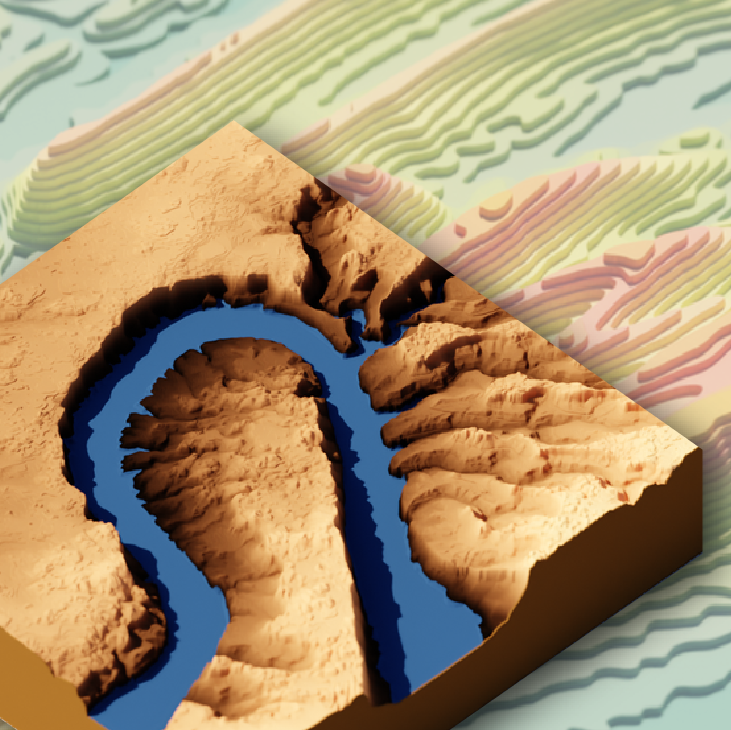
Reproducible workflows that provide the data and tools for you to get started making your own 3D graphics of topographic, satellite, and water data
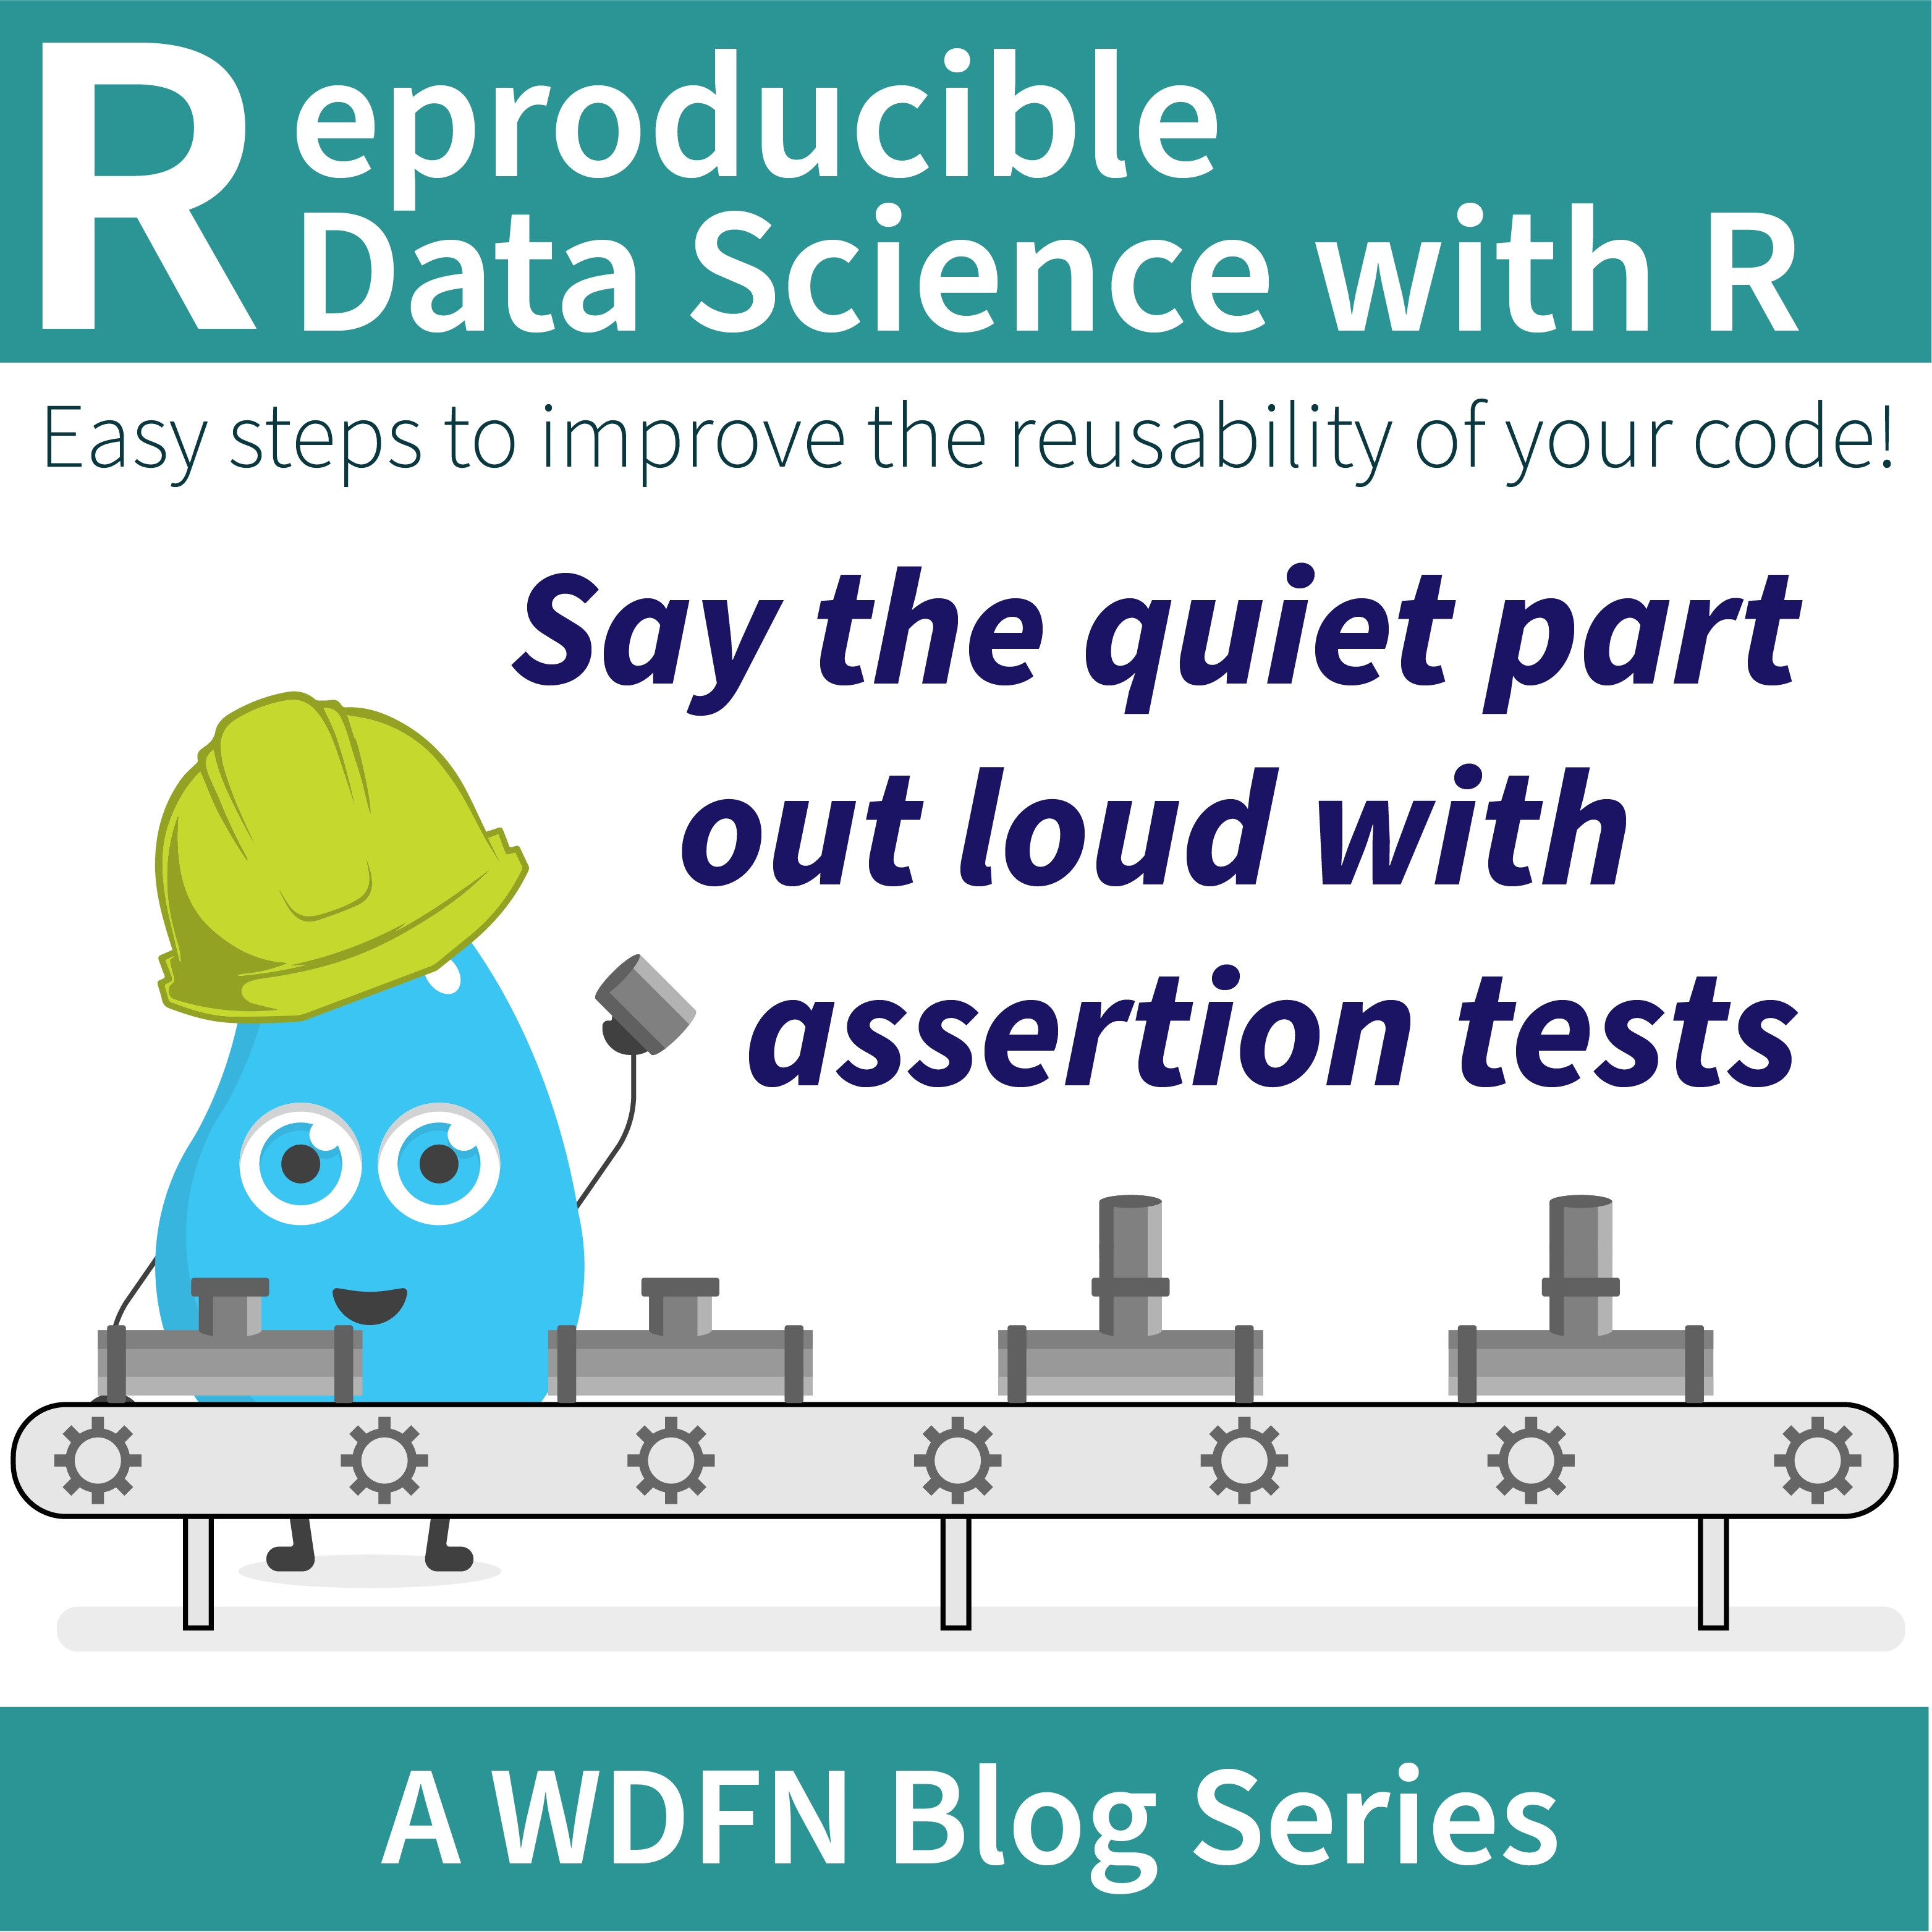
Add assertion tests to your functions to ensure assumptions are met and errors are helpful.
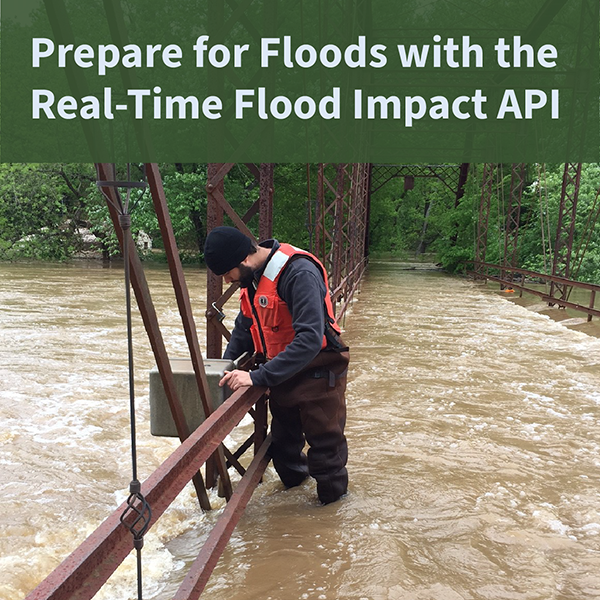
The USGS Real-Time Flood Impact (RT-FI) API service helps communities protect lives and property by providing flood risk context to widely-available USGS streamgage height measurements.