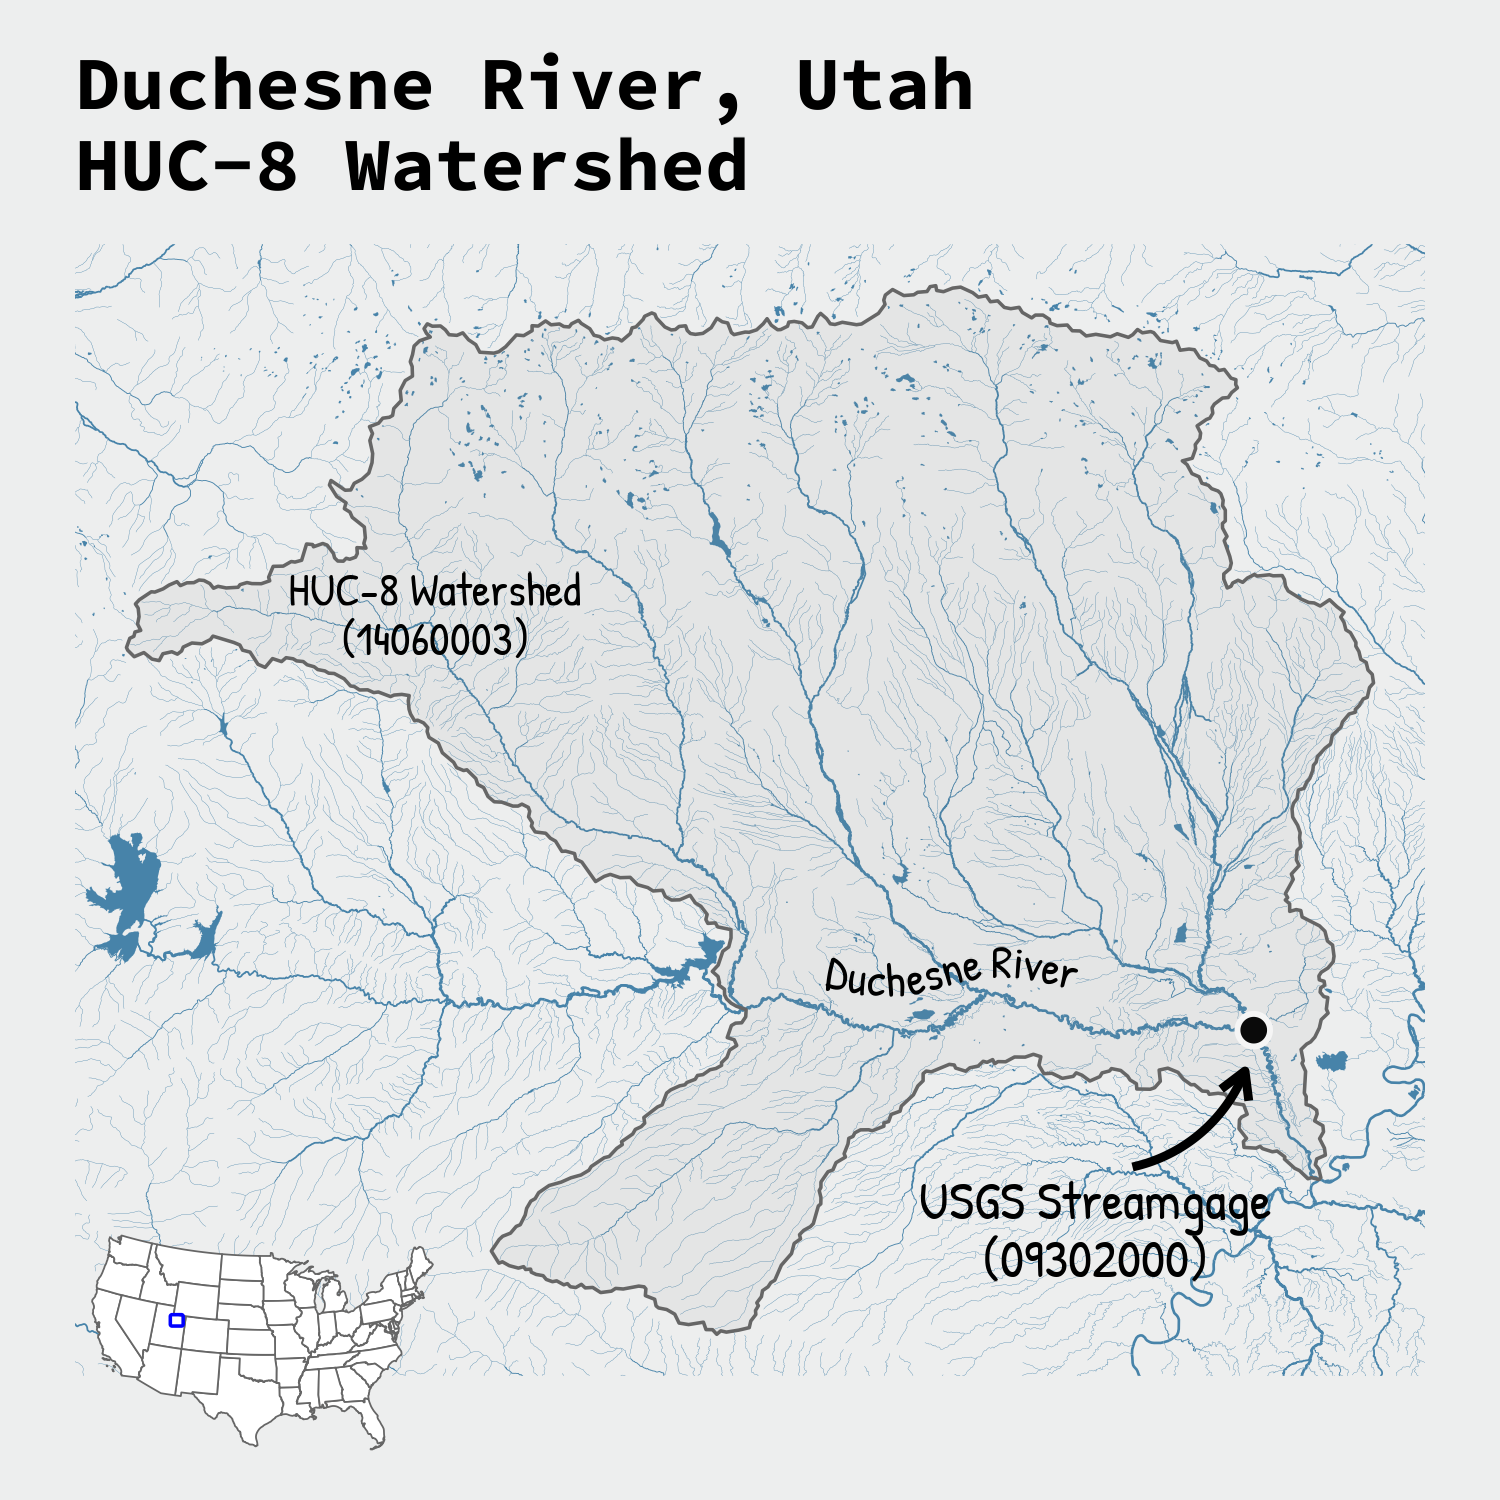
Plotting hydrography data has never been easier with the latest versions of nhdplusTools and ggplot2. This blog demonstrates how to fetch and map National Hydrography Dataset (NHD) rivers and waterbodies with several reproducible examples.
Official websites use .gov
A .gov website belongs to an official government organization in the
United States.
Secure .gov websites use HTTPS
A lock (
) or https:// means you’ve safely connected to the .gov website. Share
sensitive information only on official, secure websites.
Plotting hydrography data has never been easier with the latest versions of nhdplusTools and ggplot2. This blog demonstrates how to fetch and map National Hydrography Dataset (NHD) rivers and waterbodies with several reproducible examples.
This blog shows several different ways to visualize data from the tidycensus package for R.
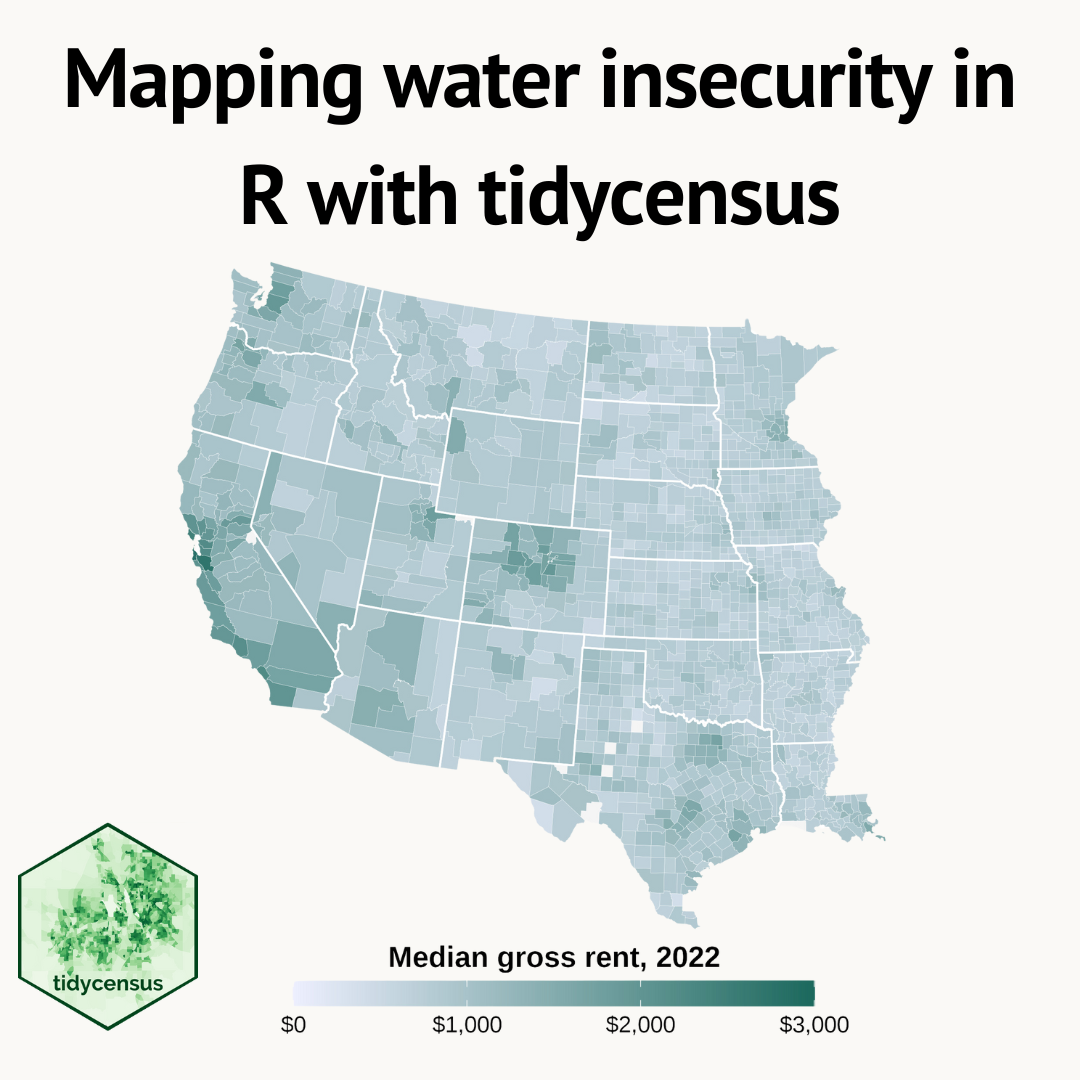
Using the tidycensus package to access and visualize American Community Survey (ACS) data.
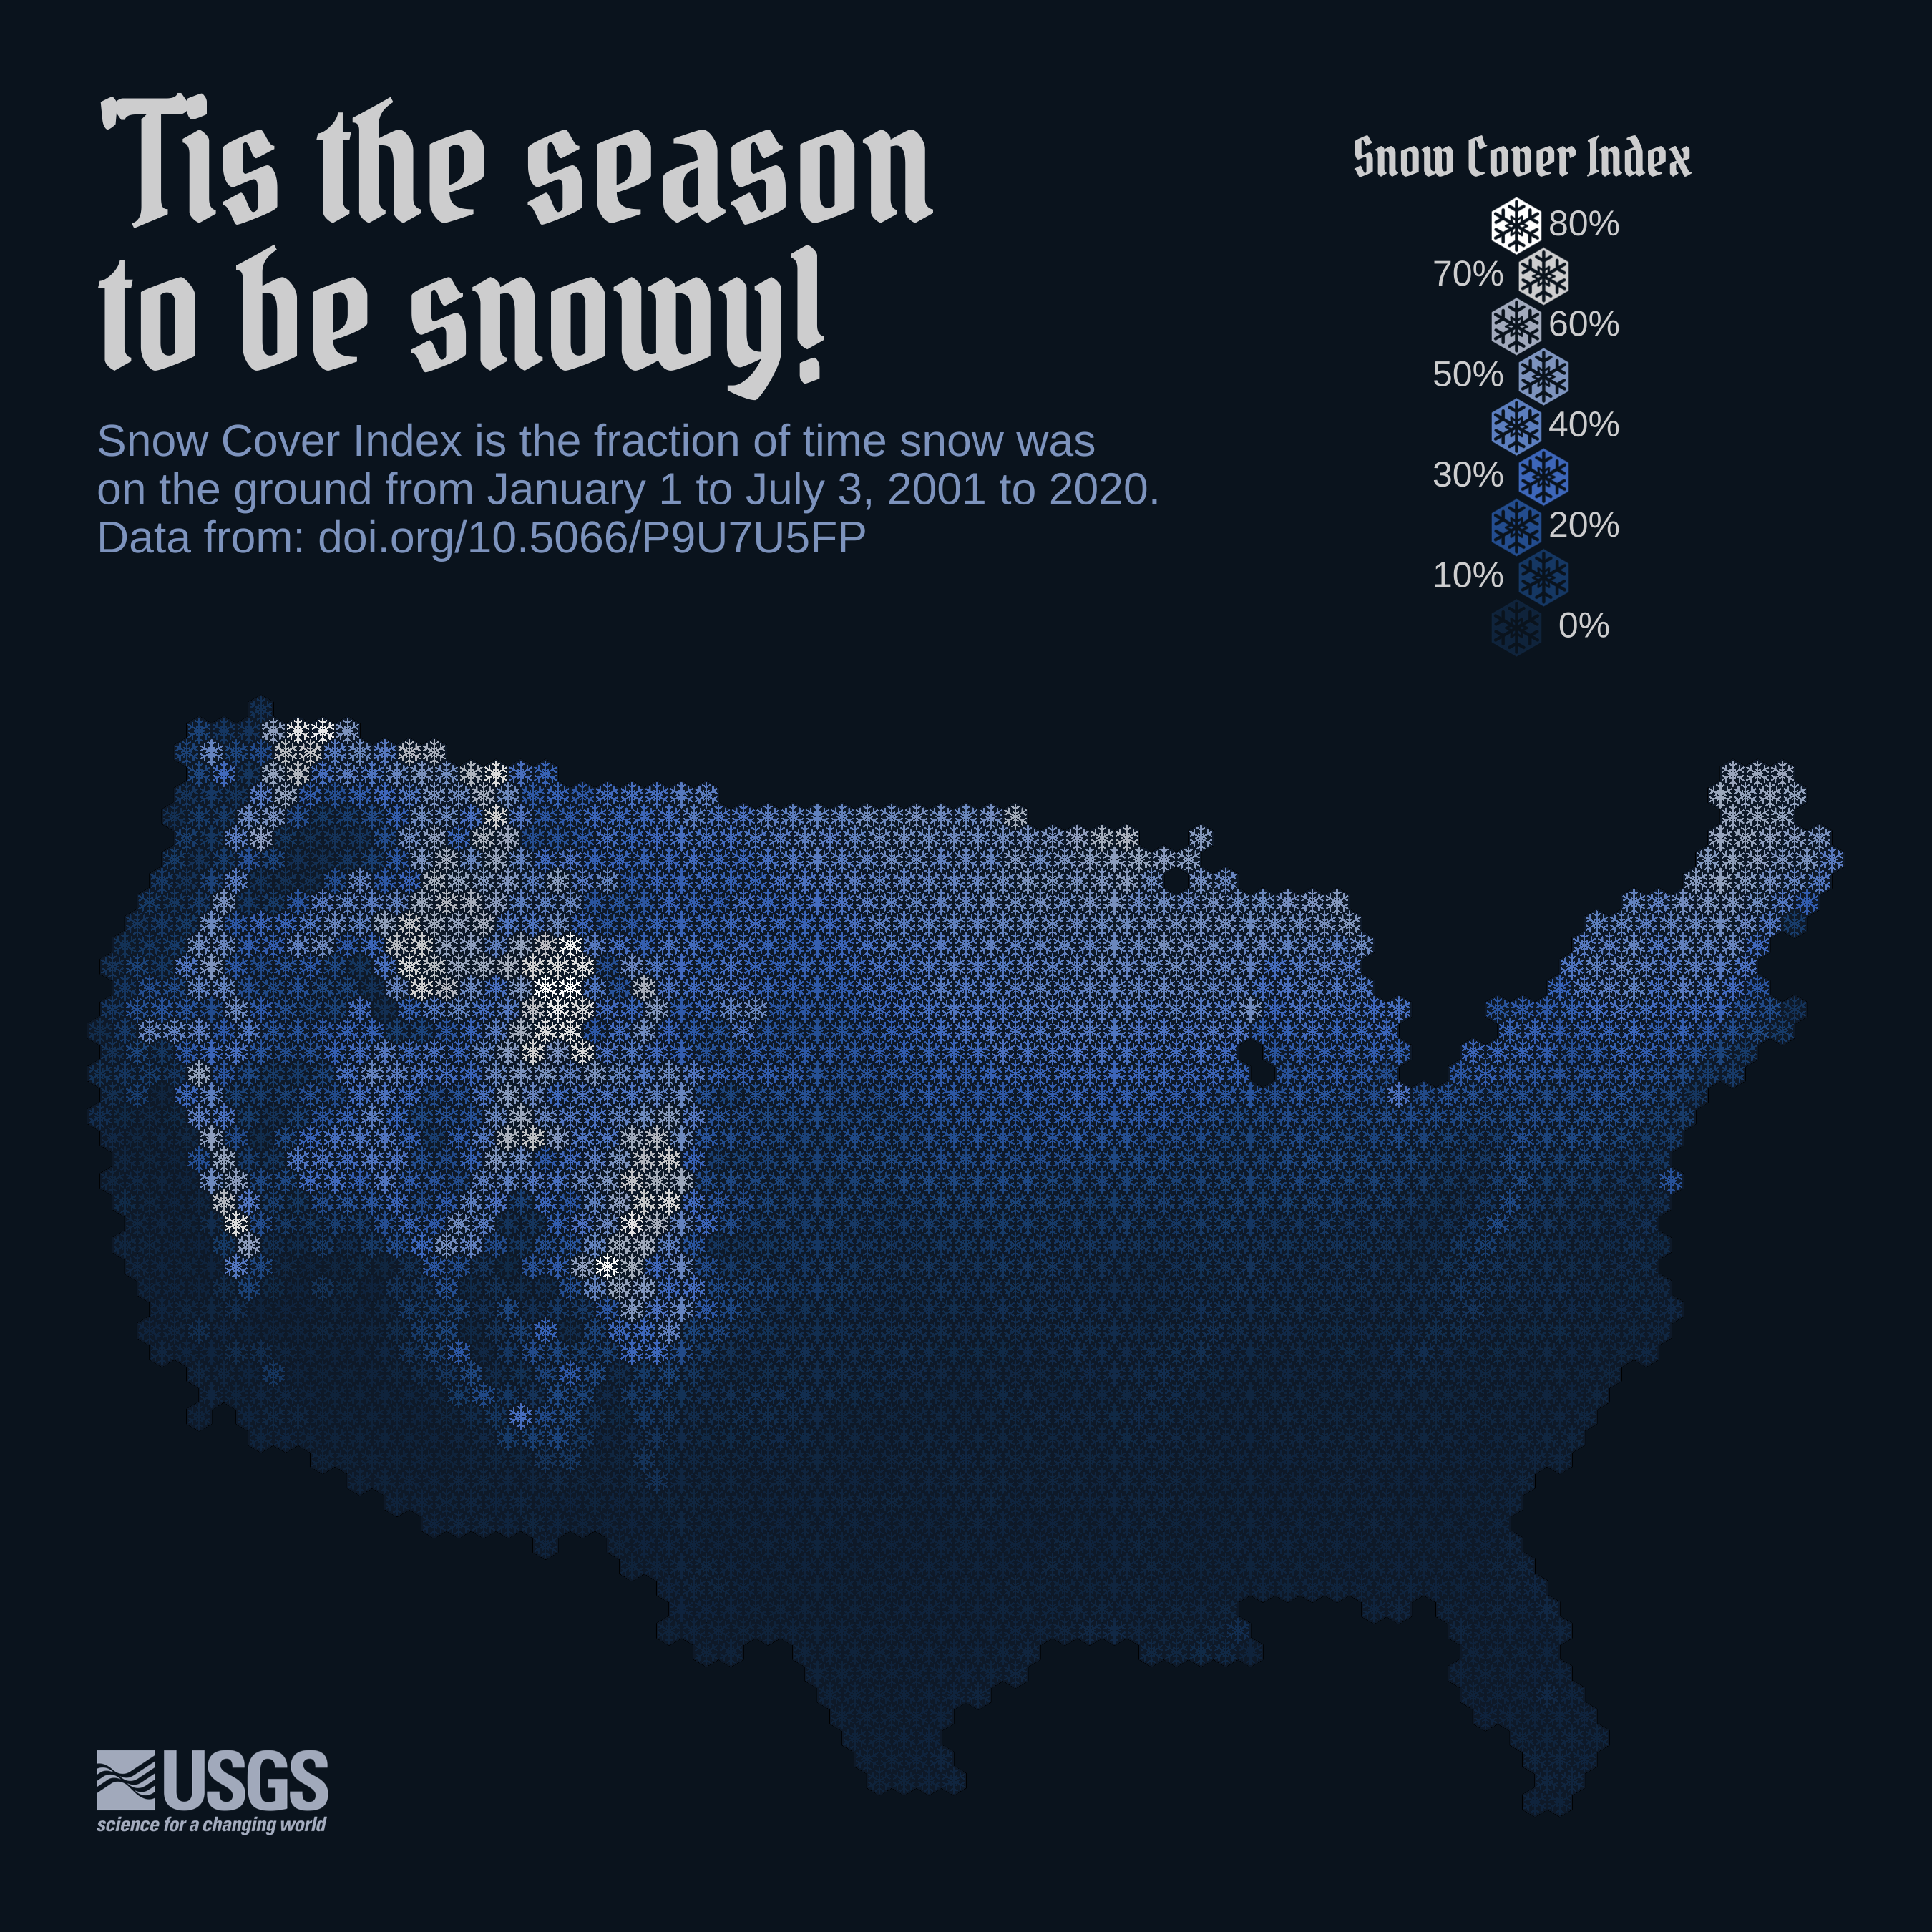
Reproducible code demonstrating the evolution of a recent data viz of CONUS snow cover
Use R to generate a video and gif similar to the Vizlab animation series, U.S. River Conditions.