
Mapping water insecurity in R with tidycensus
Using the `tidycensus` package to access and visualize American Community Survey (ACS) data.
What's on this page
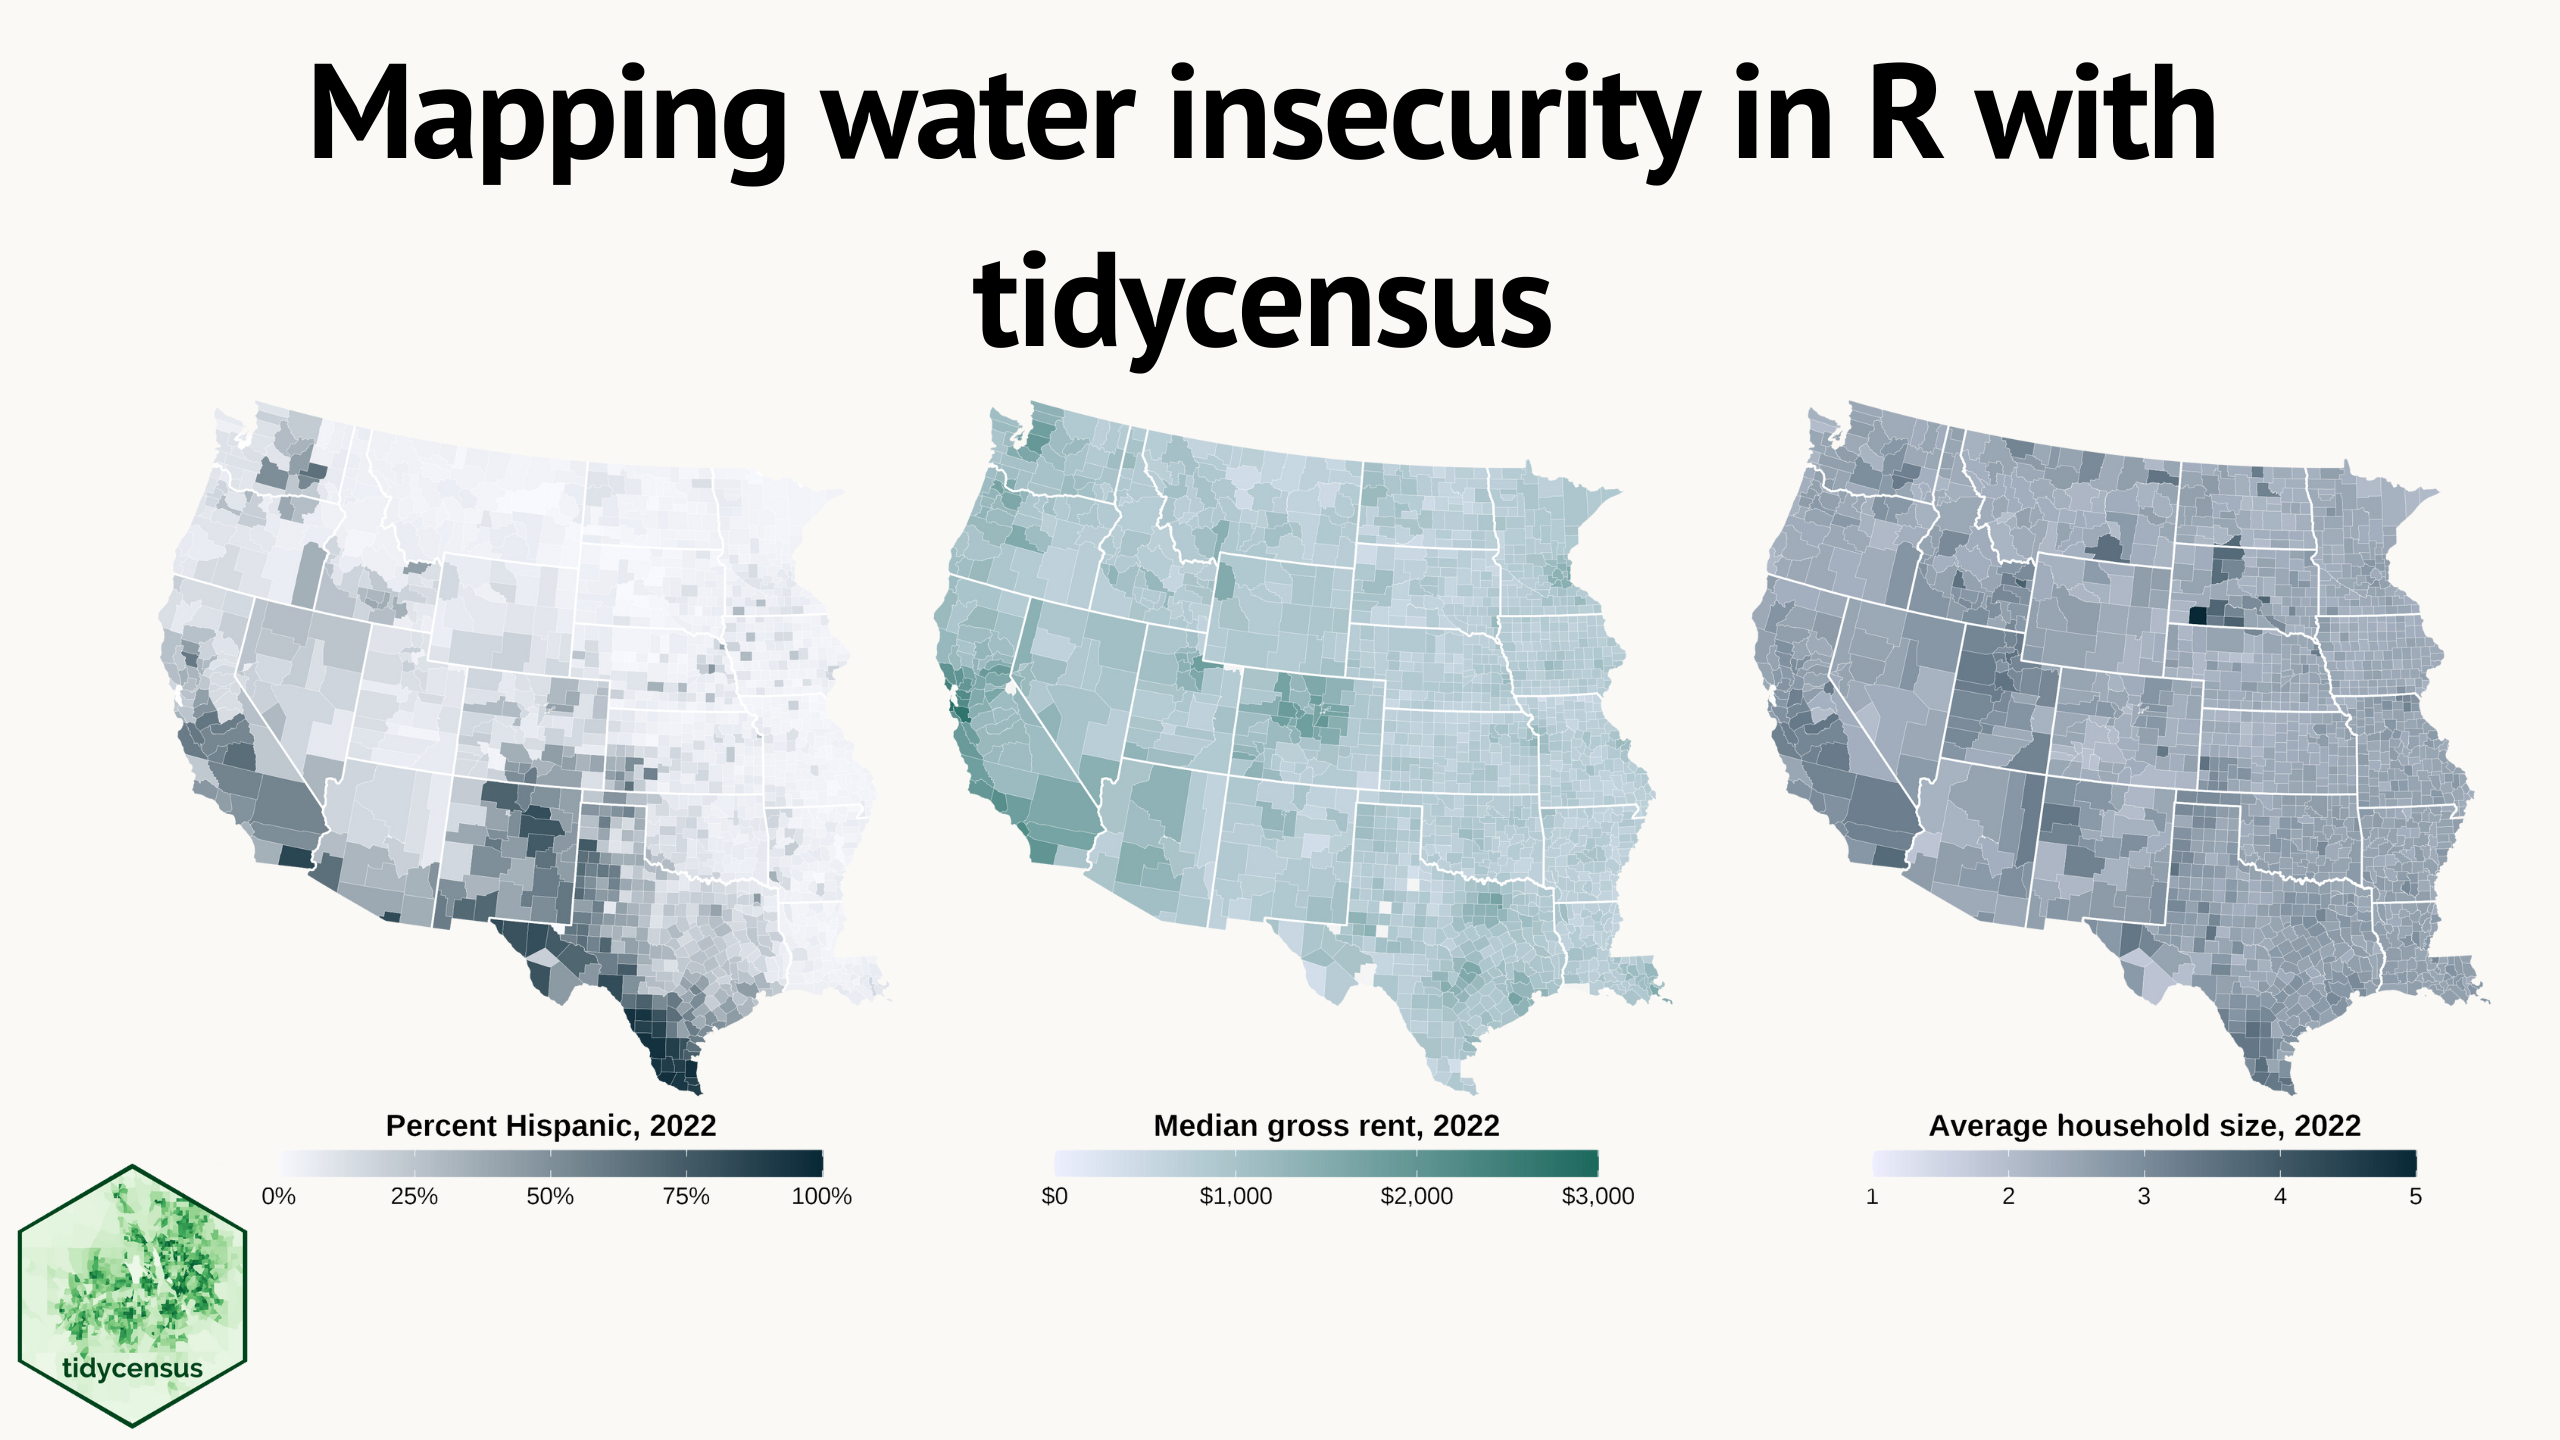
Water insecurity can be influenced by number of social vulnerability indicators—from demographic characteristics to living conditions and socioeconomic status
—that vary spatially across the U.S. This blog shows how the tidycensus
package for R can be used to access U.S. Census Bureau data, including the American Community Surveys, as featured in the “Unequal Access to Water
” data visualization from the USGS Vizlab. It offers reproducible code examples demonstrating use of tidycensus for easy exploration and visualization of social vulnerability indicators in the Western U.S.
Getting started with tidycensus
tidycensus is a package developed by Walker and Herman (2024), that helps R users access U.S. Census Bureau APIs in tidyverse
-friendly formats and sf
-compatible spatial layers. Before you can begin using tidycensus, you’ll need to install the package and set up an API key. Go to http://api.census.gov/data/key_signup.html
for an API key. Then, run the following in the R console:
# Run to install `tidycensus` and additional packages needed in this example
install.packages(c('tidycensus', 'tidyverse', 'sf','janitor', 'tigris',
'rmapshaper', 'showtext', 'scico', 'ggalt', 'plotly', 'scales'))

# Load tidycensus for processing and visualizing data
library(tidycensus)

# Set your Census API key
census_api_key("CENSUS_API_KEY", install = TRUE)

# First time, reload your environment so you can use the key without restarting R.
readRenviron("~/.Renviron")

# You can check your API key with:
Sys.getenv("CENSUS_API_KEY")
Exploring U.S. Census Bureau variables
The U.S. Census Bureau collects data such as population, age, education, and income about the American people. These data are available from a variety of sources such as the Decennial Census , American Community Survey (ACS) , and Household Pulse Survey . The Decennial Census is a complete count of the U.S. population conducted every ten years to allocate congressional representation and federal funding, while the ACS serves as an ongoing annual survey that collects detailed demographic, social, and economic data from a sample of households, for example.
The load_variables()
function lets you access U.S. Census Bureau datasets such the ACS and Decennial Census. The American Community Survey (ACS) data is available for each year since its initiation in 2005. The ACS provides both 1-year estimates (for areas with populations of 65,000 or more) and 5-year estimates (for smaller areas), which cover the following periods:
- 1-Year Estimates: Available annually from 2005 onwards.
- 5-Year Estimates: Available for the periods from 2005-2009 to the current year (e.g., the 2018-2022 estimates were released in December 2023).
Let’s begin by viewing the ACS 1-year estimates variables available for 2023:
# Load American Community Survey 1-year estimates data for 2023
acs_vars <- load_variables(2023, "acs1", cache = TRUE)

# View the first couple rows of data
head(acs_vars)

# A tibble: 6 × 3
#   name        label                                   concept
#   <chr>       <chr>                                   <chr>
# 1 B01001A_001 Estimate!!Total:                        Sex by Age (White Alone)
# 2 B01001A_002 Estimate!!Total:!!Male:                 Sex by Age (White Alone)
# 3 B01001A_003 Estimate!!Total:!!Male:!!Under 5 years  Sex by Age (White Alone)
# 4 B01001A_004 Estimate!!Total:!!Male:!!5 to 9 years   Sex by Age (White Alone)
# 5 B01001A_005 Estimate!!Total:!!Male:!!10 to 14 years Sex by Age (White Alone)
# 6 B01001A_006 Estimate!!Total:!!Male:!!15 to 17 years Sex by Age (White Alone)
Once you have identified your variables of interest, you can being pulling the associated data, specifying variables such as year, states of interest, geography (county, census tract, census division, and more). Here, we will pull total counts of owner occupied households lacking plumbing facilities across the Western U.S. (B25049_004
) and total population (B01003_001
) at the county level for 2022 and 2023. Lack of plumbing facilities can be defined as a household that does not have complete plumbing facilities, which are typically defined as:
- Hot and cold running water
- A flush toilet
- A bathtub or shower
With the Census variable identified, we can now begin pulling Census data. To do this we will write our own function to do this. If you are unfamiliar with writing functions, see the Writing functions that work for you and Writing better functions blog posts to get you started.
#' @title Pull U.S. Census Bureau ACS data
#' @description pull census data of interest with set geography, variable of
#'   interest, and year.
#' @param geography, the geography of your data
#' @param variable, character string or vector of character strings of variable
#'   IDs. tidycensus automatically returns the estimate and the margin of error
#'   associated with the variable.
#' @param states, An optional vector of states for which you are requesting
#'   data. State names, postal codes, and FIPS codes are accepted. Defaults to
#'   NULL.
#' @param year, the year, or endyear, of the ACS sample. 5-year ACS data is
#'   available from 2009 through 2021; 1-year ACS data is available from 2005
#'   through 2021, with the exception of 2020. Defaults to 2021.
#' @param, survey_var, character, The ACS contains one-year, three-year, and
#'   five-year surveys expressed as "acs1", "acs3", and "acs5". The default
#'   selection is "acs5." See `?get_acs()` for more information.
#' @param proj, set projection
#' @return a dataframe with census data

library(sf) # For spatial data processing
library(janitor) # For cleaning column names

get_census_data <- function(geography, var_names, states, year, proj, survey_var) {

  # Obtain data and feature geometry for ACS data and processing it
  df <- get_acs(
    geography = geography,
    variable = var_names,
    state = states,
    year = year,
    geometry = TRUE,
    survey = survey_var) |>
    # standardize and clean column names
    clean_names() |>
    # set projection of data
    st_transform(proj)

    return(df)
}

# List of states to filter Census data by
western_states <- c('Washington', 'Oregon', 'California', 'Idaho', 'Nevada',
               'Utah', 'Arizona', 'Montana', 'Wyoming', 'Colorado',
               'New Mexico', 'North Dakota', 'South Dakota', 'Nebraska', 'Kansas',
               'Oklahoma', 'Texas', 'Minnesota', 'Iowa', 'Missouri',
               'Arkansas', 'Louisiana')

# Define the variable names: total population and plumbing lacking households
# B01003_001: total population, B25049_004: households lacking plumbing
vars <- c("B01003_001", "B25049_004")

# Pull data for 2023 and 2022
western_data_2023 <- get_census_data(
  geography = 'county',
  var_names = vars,
  states = western_states,
  year = 2023,
  proj = "EPSG:5070",
  survey_var = "acs1"
)

western_data_2022 <- get_census_data(
  geography = 'county',
  var_names = vars,
  states = western_states,
  year = 2022,
  proj = "EPSG:5070",
  survey_var = "acs1"
)
You can use get_acs()
for obtaining data and feature geometry for the ACS. Similarly, you can use get_decennial()
to obtain data and feature geometry for the Decennial Census. For the case of this blog, we used a function to pull ACS U.S. Census Bureau data.
Processing U.S. Census Bureau data
The total owner occupied households lacking plumbing facilities across counties the Western U.S. for 2023 and 2022 are contained in the western_data_2023 and western_data_2022 data frames, respectively. The datasets, western_data_2023 and western_data_2022, contain information about counties in the Western U.S., including population numbers, households lacking plumbing, and their geographic boundaries. Each row represents a county, with columns showing the county’s ID (geoid), county name, the type of data (e.g., total population or households lacking plumbing), the estimated value, the margin of error (moe), and the county’s map boundaries (geometry). Let’s now do some processing to get the data in a wide format, create new column names for the Census variables, and calculate the percent of the total county populations lacking plumbing facilities.
library(tidyverse) # For dataframe processing

# Pivot data to wider format for 2023
western_data_2023_wide <- western_data_2023 |>
  # new column variable_long based on the value of the variable column
  mutate(
    variable_long = case_when(
      variable == "B01003_001" ~ "total_pop",
      variable == "B25049_004" ~ "plumbing",
      .default = NA_character_  # In case there are any other variables
      )
    ) |>
  select(geoid, name, variable_long, estimate, geometry) |>
  pivot_wider(
    names_from = variable_long,
              values_from = estimate
    ) |>
  # Add a column for percent of population lacking plumbing in 2023
  mutate(
    percent_lacking_plumbing = (plumbing / total_pop) * 100
    )

# Pivot data to wider format for 2022
western_data_2022_wide <- western_data_2022 |>
  # new column variable_long based on the value of the variable column
  mutate(
    variable_long = case_when(
      variable == "B01003_001" ~ "total_pop",
      variable == "B25049_004" ~ "plumbing",
      .default = NA_character_  # In case there are any other variables
      )
    ) |>
  select(geoid, name, variable_long, estimate, geometry) |>
  pivot_wider(
    names_from = variable_long,
    values_from = estimate
    ) |>
  # Add a column for percent of population lacking plumbing in 2022
  mutate(
    percent_lacking_plumbing = (plumbing / total_pop) * 100
    )
Visualizing U.S. Census Bureau data with tigris and sf
Let’s plot the data! Using the tigris
package we can directly access TIGER/Line shapefiles
from the U.S. Census Bureau for U.S. political boundaries:
library(tigris) # For downloading and using cartographic boundary shapefiles
library(rmapshaper) # For simplifing spatial objects
library(showtext) # For adding custom fonts
library(scico) # For adding color palettes

western_sf <-
  # download a generalized (1:500k) states file
  states(cb = TRUE) |>
  # set projection
  st_transform("EPSG:5070") |>
  # standardize column names
  clean_names() |>
  # filter data for Western states
  filter(name %in% western_states) |>
  # simplify spatial data
  ms_simplify(keep = 0.2)

western_counties_sf <-
  # download a generalized (1:500k) counties file
  counties(cb = TRUE) |>
  # set projection
  st_transform("EPSG:5070") |>
  # standardize column names
  clean_names() |>
  # filter data for Western counties
  filter(state_name %in% western_states) |>
  # simplify spatial data
  ms_simplify(keep = 0.2)

# Load custom font for legend title
font_legend <-"Source Sans Pro"
font_add_google(font_legend)
showtext_opts(dpi = 300, regular.wt = 200, bold.wt = 700)
showtext_auto(enable = TRUE)

map_change_plumbing <- function(data, year){
  map_chloropleth_change <-
    data |>  #  load the census data
    ggplot(
      aes(fill = percent_lacking_plumbing) # Set fill variable
    ) +
    geom_sf(
      color = "white", # Plot with white boundaries
      linewidth = 0.05 # Set the width of the boundary lines
    ) +
    geom_sf(
      data = western_sf, # Add state boundaries for overlay
      fill = NA, # No fill for this layer
      color = "white",  # Set the boundary color to white
      linewidth = 0.1, # Set the width of the boundary lines
      linetype = "solid" # Use solid lines for the boundaries
    ) +
    geom_sf(
      data = western_counties_sf, # Add county boundaries for overlay
      fill = NA, # No fill for this layer
      color = "grey80", # Set the boundary line color to gray
      linewidth = 0.09, # Set the width of the boundary lines
      linetype = "solid" # Use solid lines for the boundaries
    ) +
    theme_void() +  # Remove axis text and labels
    theme(
      text = element_text(family = font_legend, size = 16), # Custom font
      legend.margin = margin(t = 5, b = 2), # Set margins for the legend
      legend.position = 'bottom', # Position the legend at the bottom
      legend.title.align = 0.5 # Center-align the legend title
    ) +
    guides(
      fill = guide_colorbar( # Customize the color bar legend
        title.position = "top",  # Position the title at the top
        # Customize title text
        title.theme = element_text(
          face = 'bold',
          family = font_legend,
          size = 16
        ),
        direction = "horizontal", # Orient the color bar horizontally
        position = "bottom",  # Position the color bar at the bottom
        barwidth = 20, # Set the width of the color bar
        barheight = 1) # Set the height of the color bar
    ) +
    scale_fill_scico(
      name = sprintf("Households lacking plumbing (%s)", year), # Legend title
      limits = c(0, 5), # Set the range of values for the fill scale
      breaks = c(0, 1, 2, 3, 4, 5), # Set break points for the legend
      palette = "lajolla",  # Use the "lajolla" palette from `scico`
      direction = -1, # Swap "lajolla" palette direction
      end = 0.95, # Edit interval within palette to sample colors from
      na.value="white", # Assign NA values as white
      labels = function(x) paste0(x, "%"))  # Paste % labels on legend

  return(map_chloropleth_change)
}

# View your maps
map_change_plumbing(data = western_data_2023_wide, year = 2023)
map_change_plumbing(data = western_data_2022_wide, year = 2022)
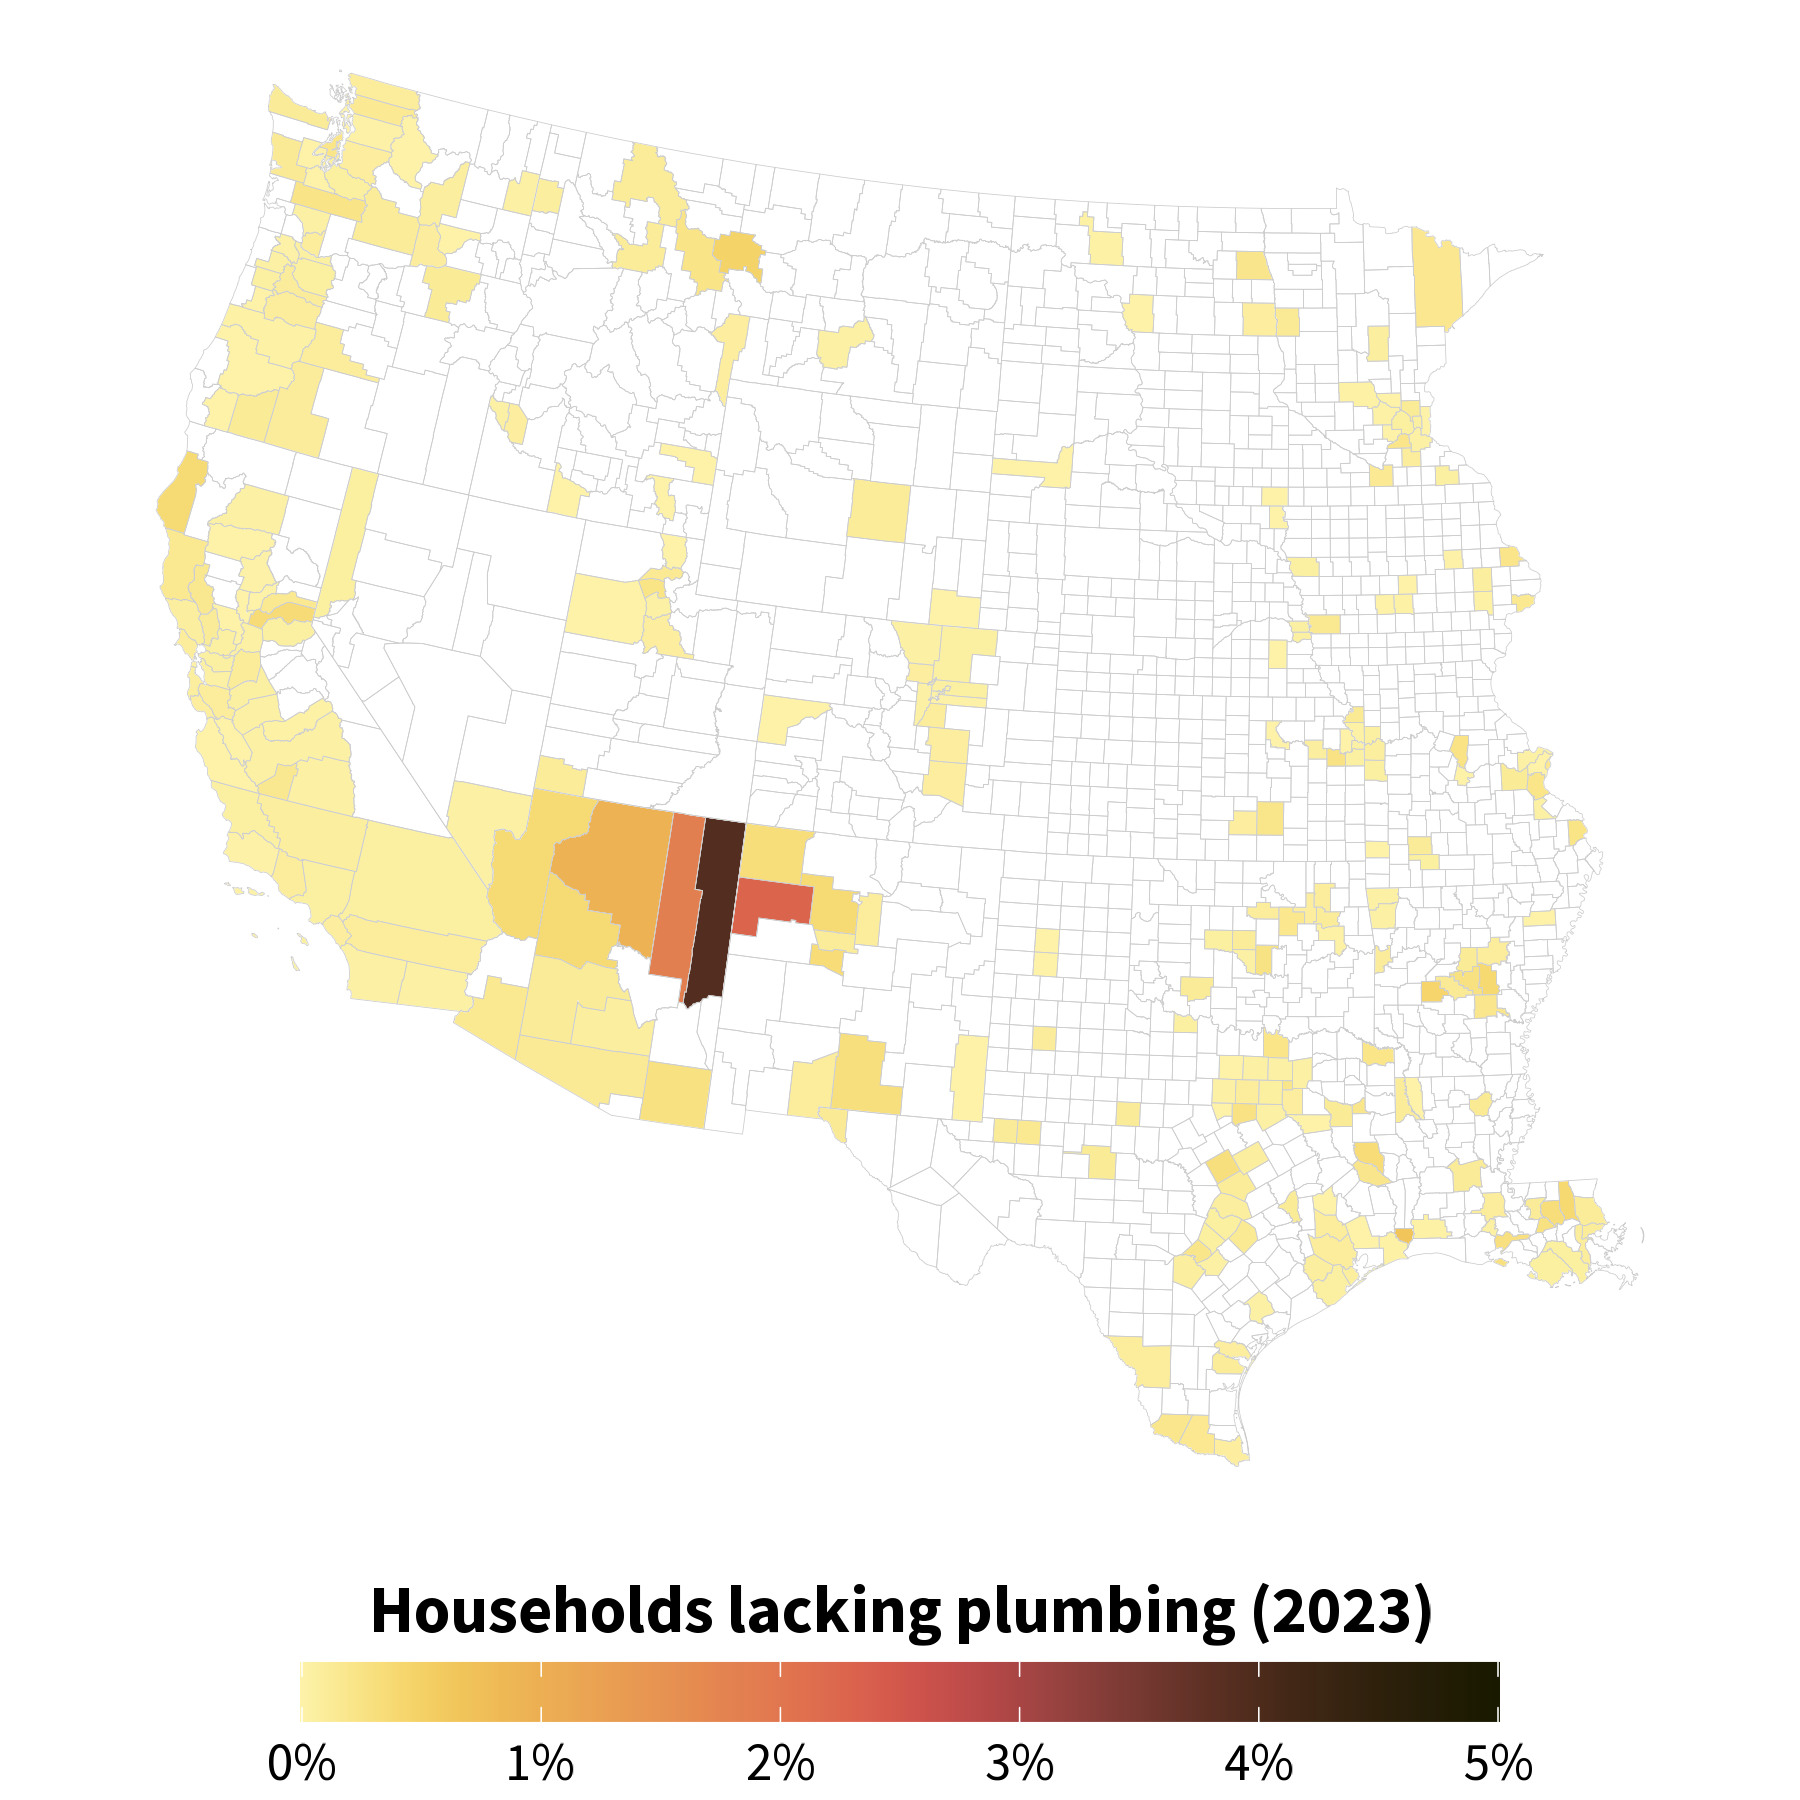
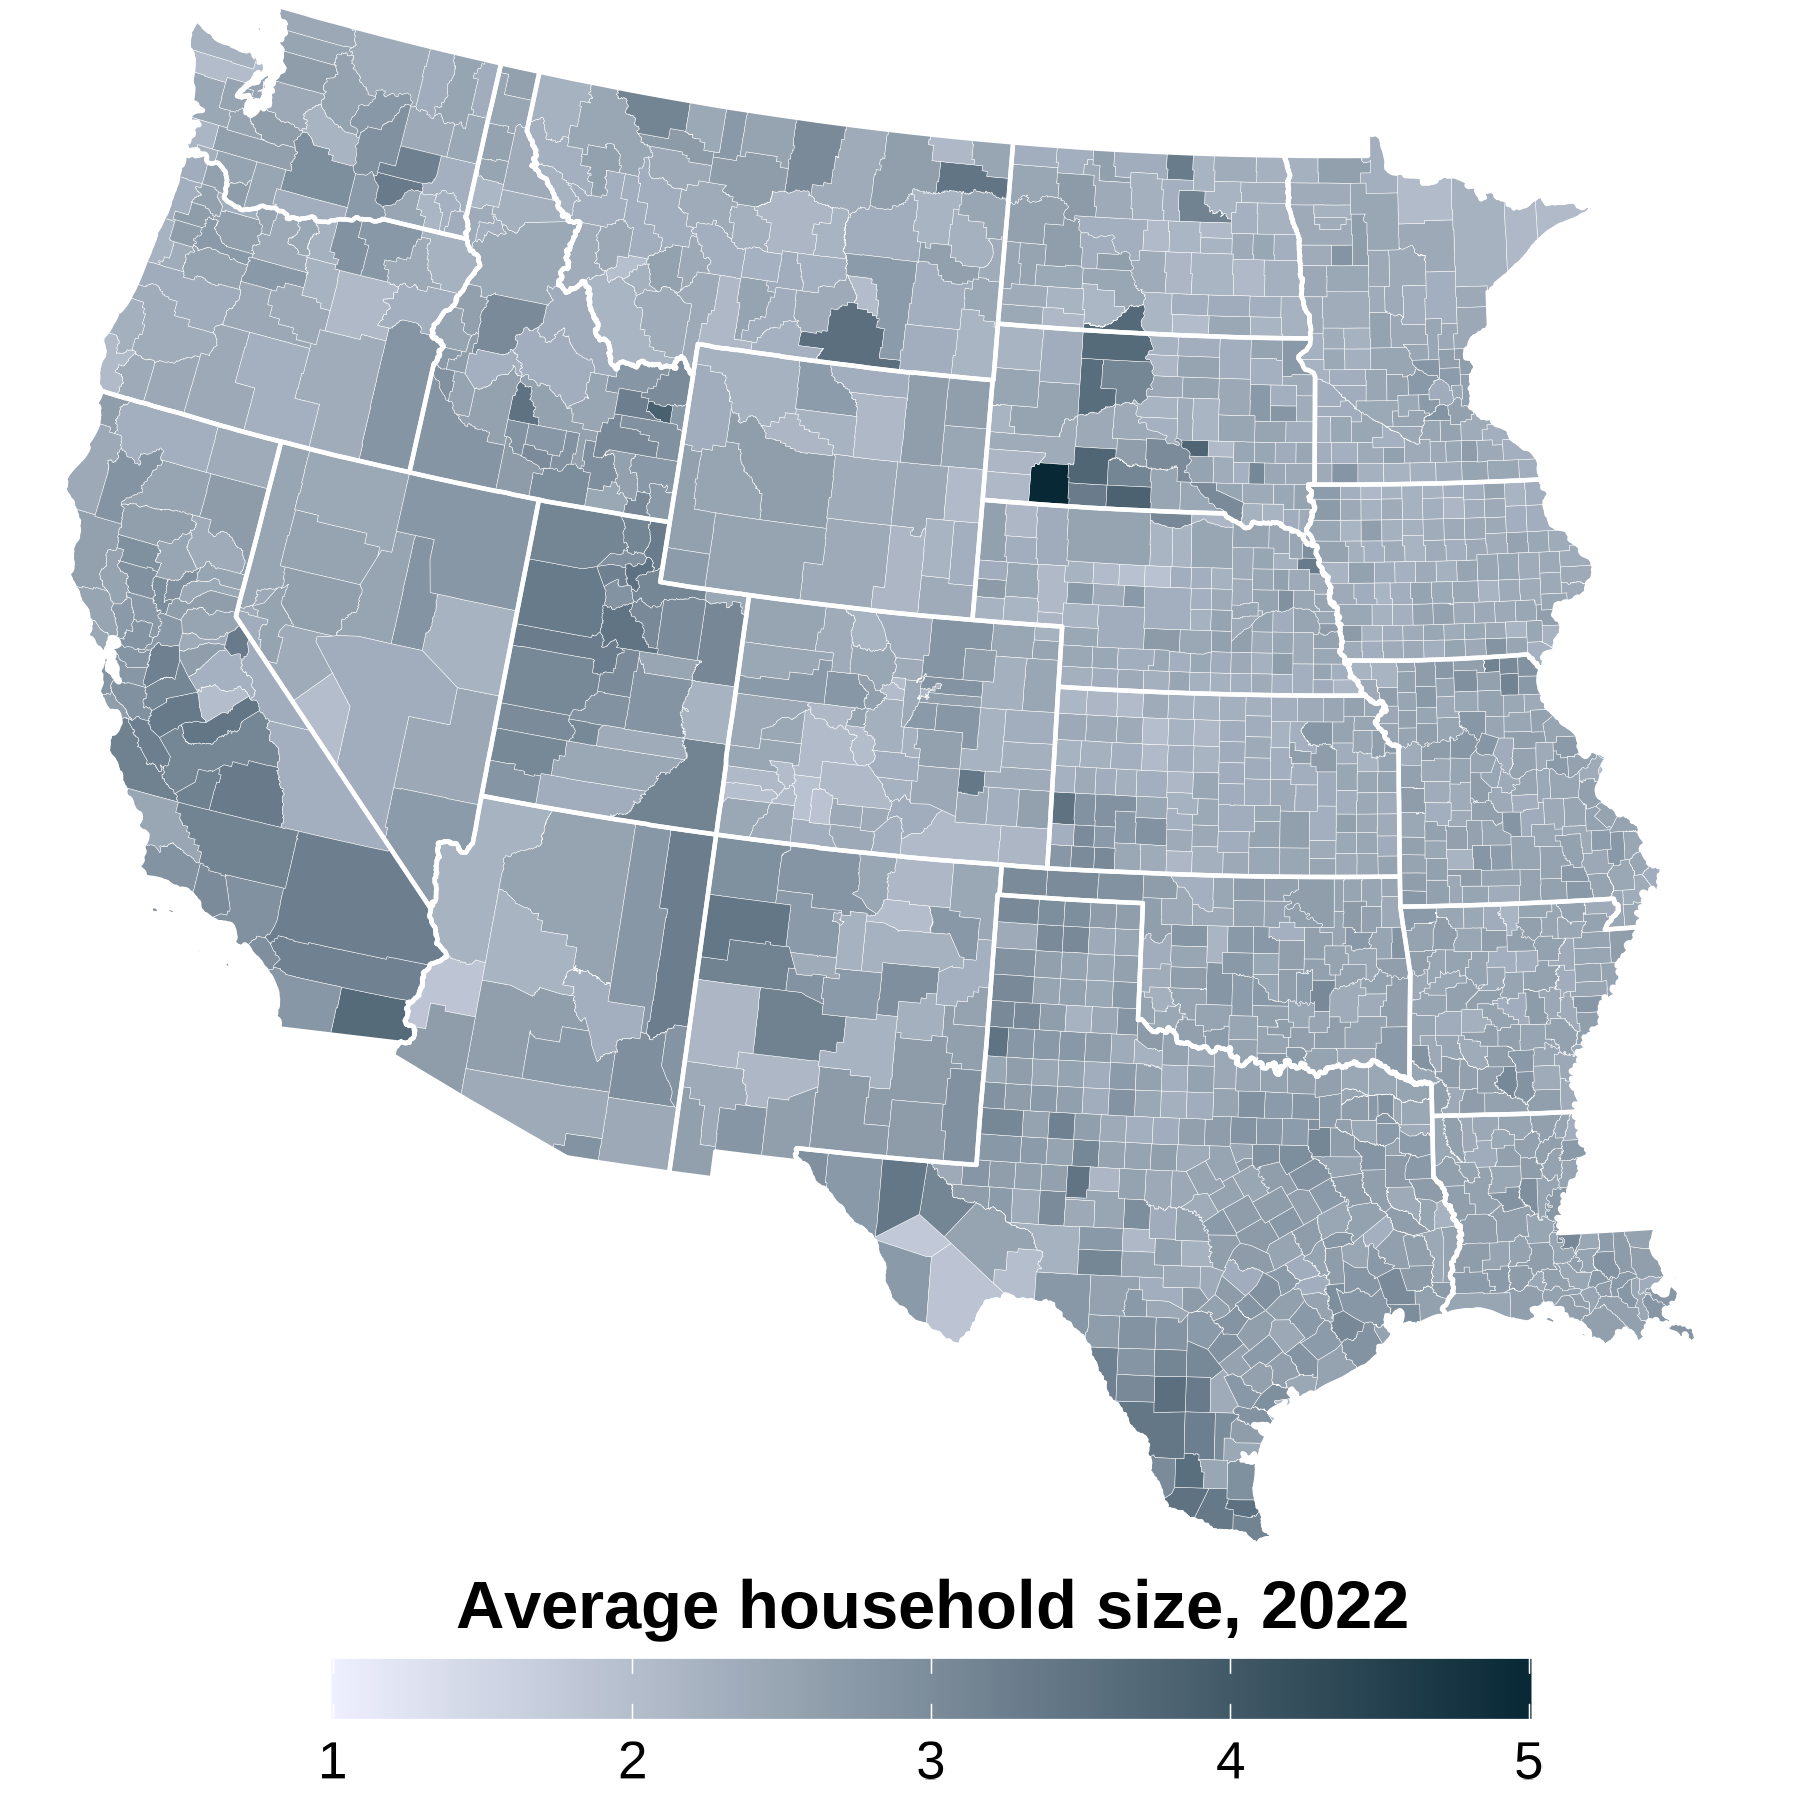
Choropleth map of percent of households lacking plumbing facilities in 2023 across counties in the Western U.S. Counties with the greatest percent of lacking plumbing facilities include Apache County, AZ (3.9%), McKinley County, NM (2.3%), and Navajo County, AZ (1.9%).

Choropleth map of percent of households lacking plumbing facilities in 2022 across counties in the Western U.S. Counties with the greatest percent of lacking plumbing facilities include Apache County, AZ (3.7%), McKinley County, NM (2.8%), and Navajo County, AZ (1.6%).
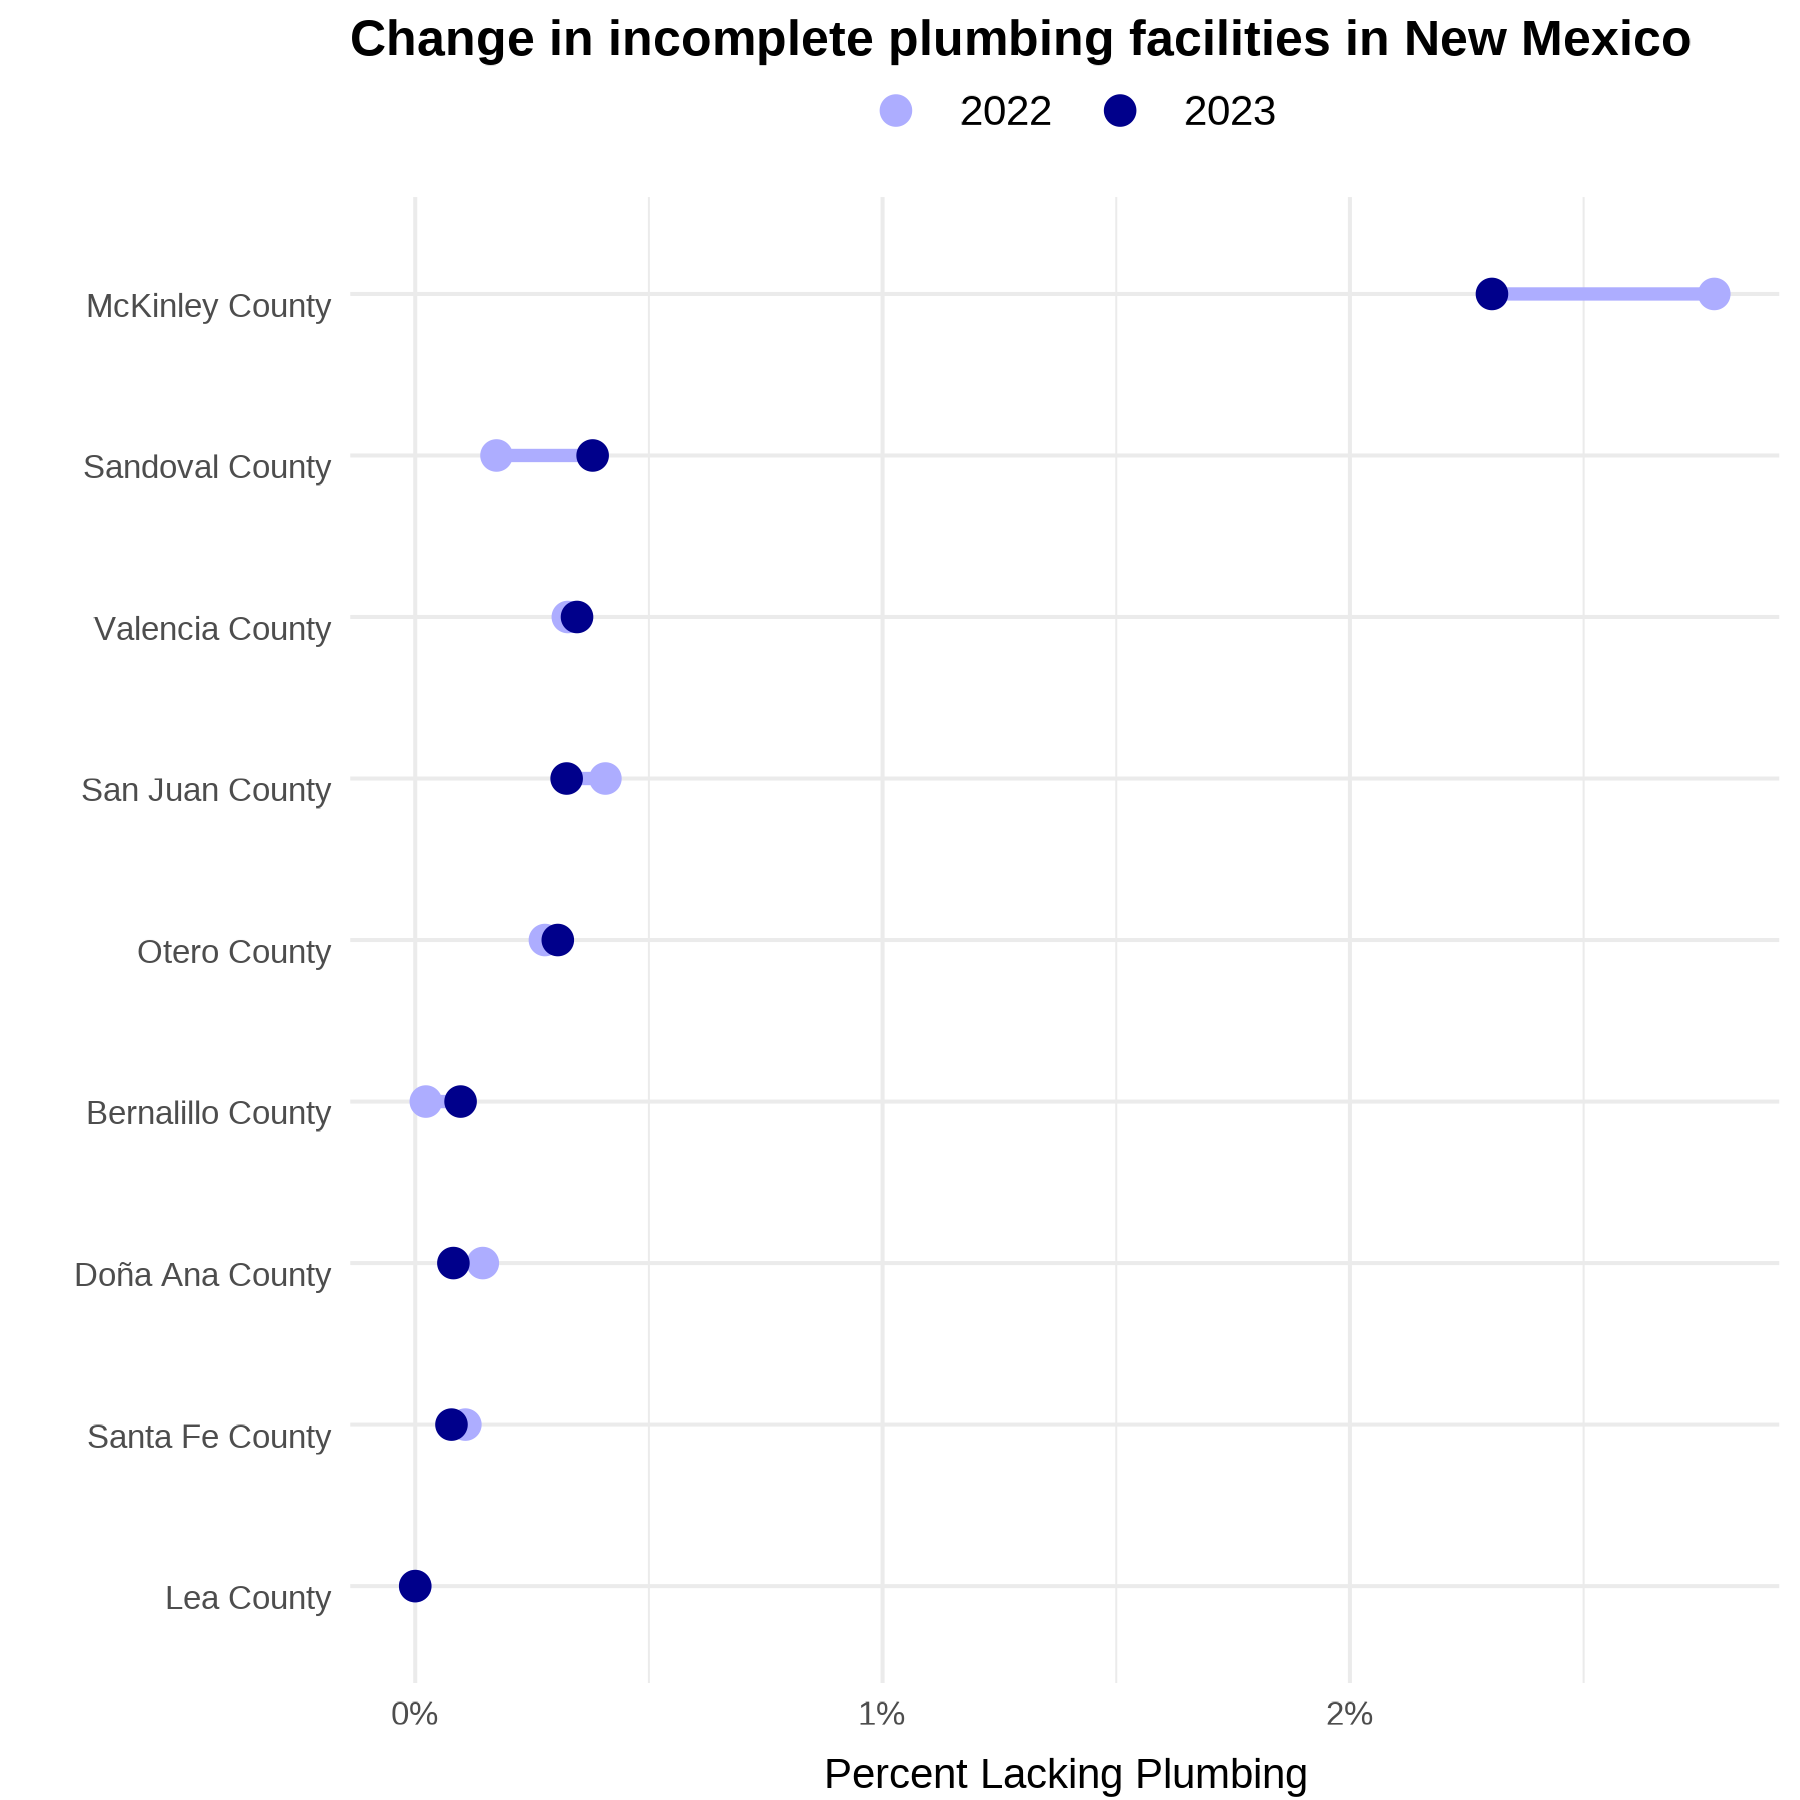
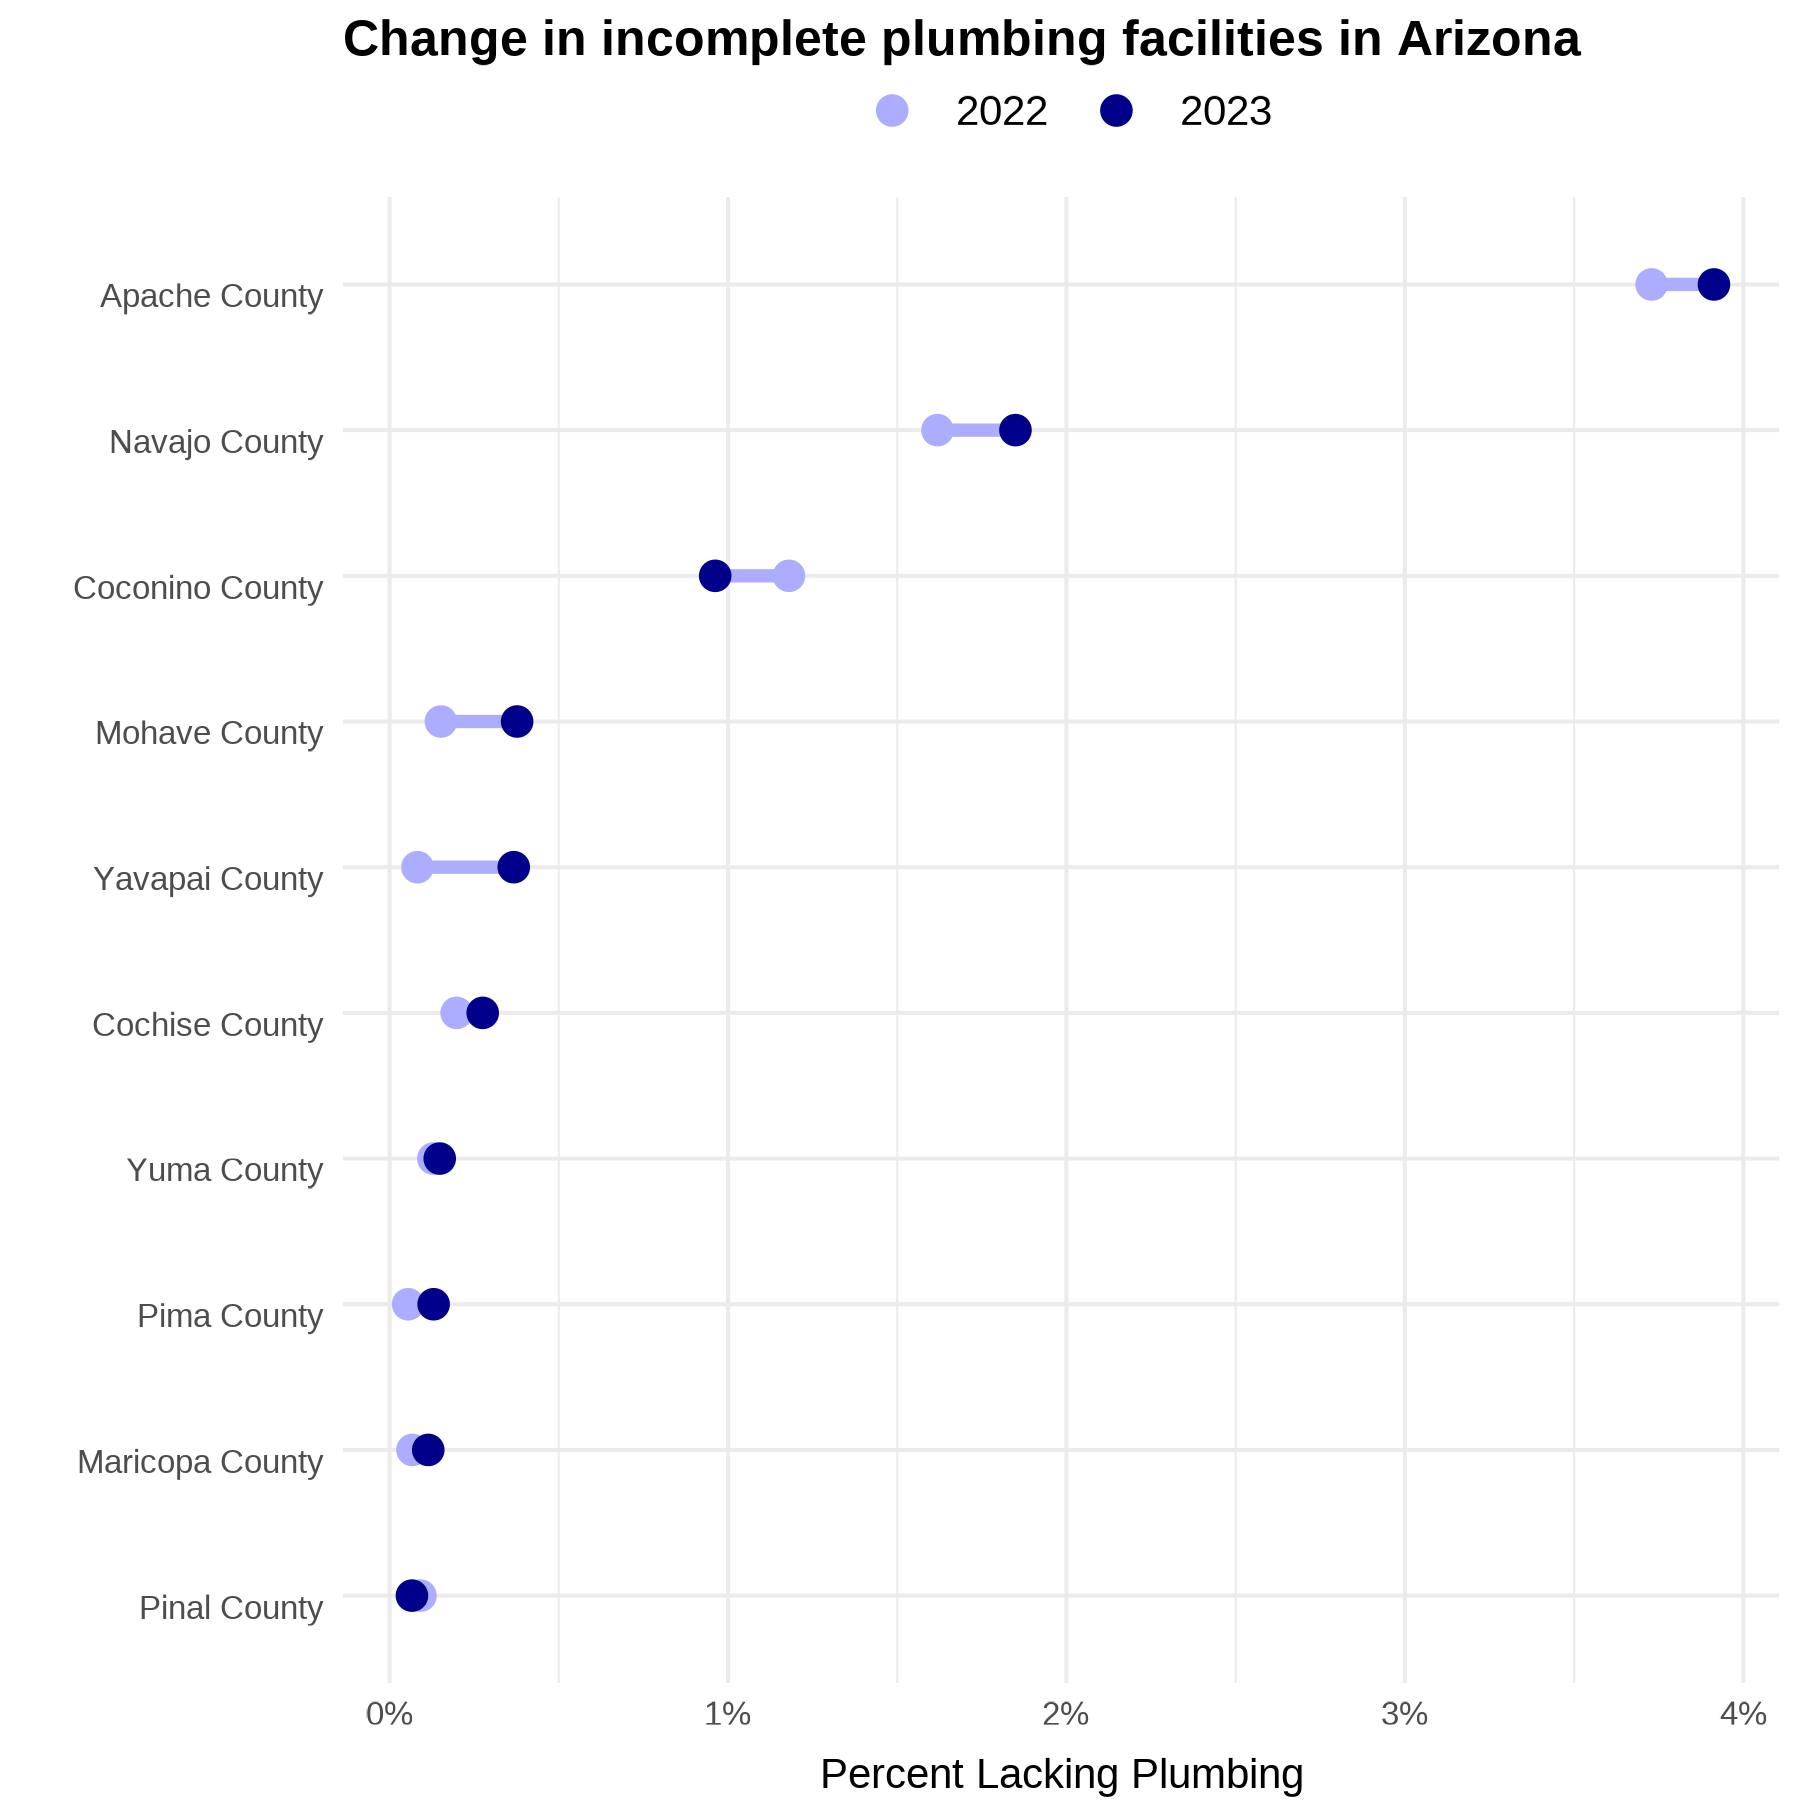
View differences in percent plumbing facilties for states of interest
Let’s now take a look certain states in the Western U.S. and how lack of complete indoor plumbing compares between 2022 and 2023 Census data. This county-level figure displays patterns and differences that provide deeper insight into infrastructure disparities and water insecurity across the region.
library(ggalt) # For creating dumbbell charts

plot_dumbbell <- function(data, state_of_interest) {

  dumbbell <- ggplot(
    data |>
      filter(state %in% state_of_interest),
    aes(
      y = reorder(county, percent_lacking_plumbing_2023)
    )
  ) +
    geom_dumbbell(
      aes(
        x = percent_lacking_plumbing_2022,
        xend = percent_lacking_plumbing_2023
      ),
      size = 1.5,
      color = "#adadff"
    ) +
    geom_point(
      aes(
        x = percent_lacking_plumbing_2022,
        # Map color to a label
        color = "2022"
      ),
      size = 3
    ) +
    geom_point(
      aes(
        x = percent_lacking_plumbing_2023,
        # Map color to a label
        color = "2023"
      ),
      size = 3
    ) +
    labs(
      title = sprintf(
        "Change in incomplete plumbing facilities in %s",
        state_of_interest
      ),
      x = "Percent Lacking Plumbing",
      y = " ",
      # Add legend title
      color = "Year"
    ) +
    # Define colors for the legend
    scale_color_manual(
      values = c("2022" = "#adadff",
                 "2023" = "#00008B")
    ) +
    theme_minimal(base_size = 10) +
    theme(
      axis.text.y = element_text(size = 8,
                                 hjust = 1, vjust = 1),
      axis.title.x = element_text(vjust = -1),
      plot.title = element_text(hjust = 0,
                                face = "bold",
                                size = 12),
      # Move legend to the top
      legend.position = "top",
      # Make legend horizontal
      legend.direction = "horizontal",
      # Remove legend title (optional)
      legend.title = element_blank(),
      # Adjust margin to bring it closer to the title
      legend.margin = margin(t = -5),
      # Increase legend text size
      legend.text = element_text(size = 10),
      legend.key.size = unit(1.5, "lines"),
    ) +
    scale_x_continuous(labels = function(x) paste0(x, "%"))

  return(dumbbell)
}

# Call the function with the data and states of interest
plot_dumbbell(data = western_data_2023_2022, state_of_interest = "New Mexico")
plot_dumbbell(data = western_data_2023_2022, state_of_interest = "Arizona")
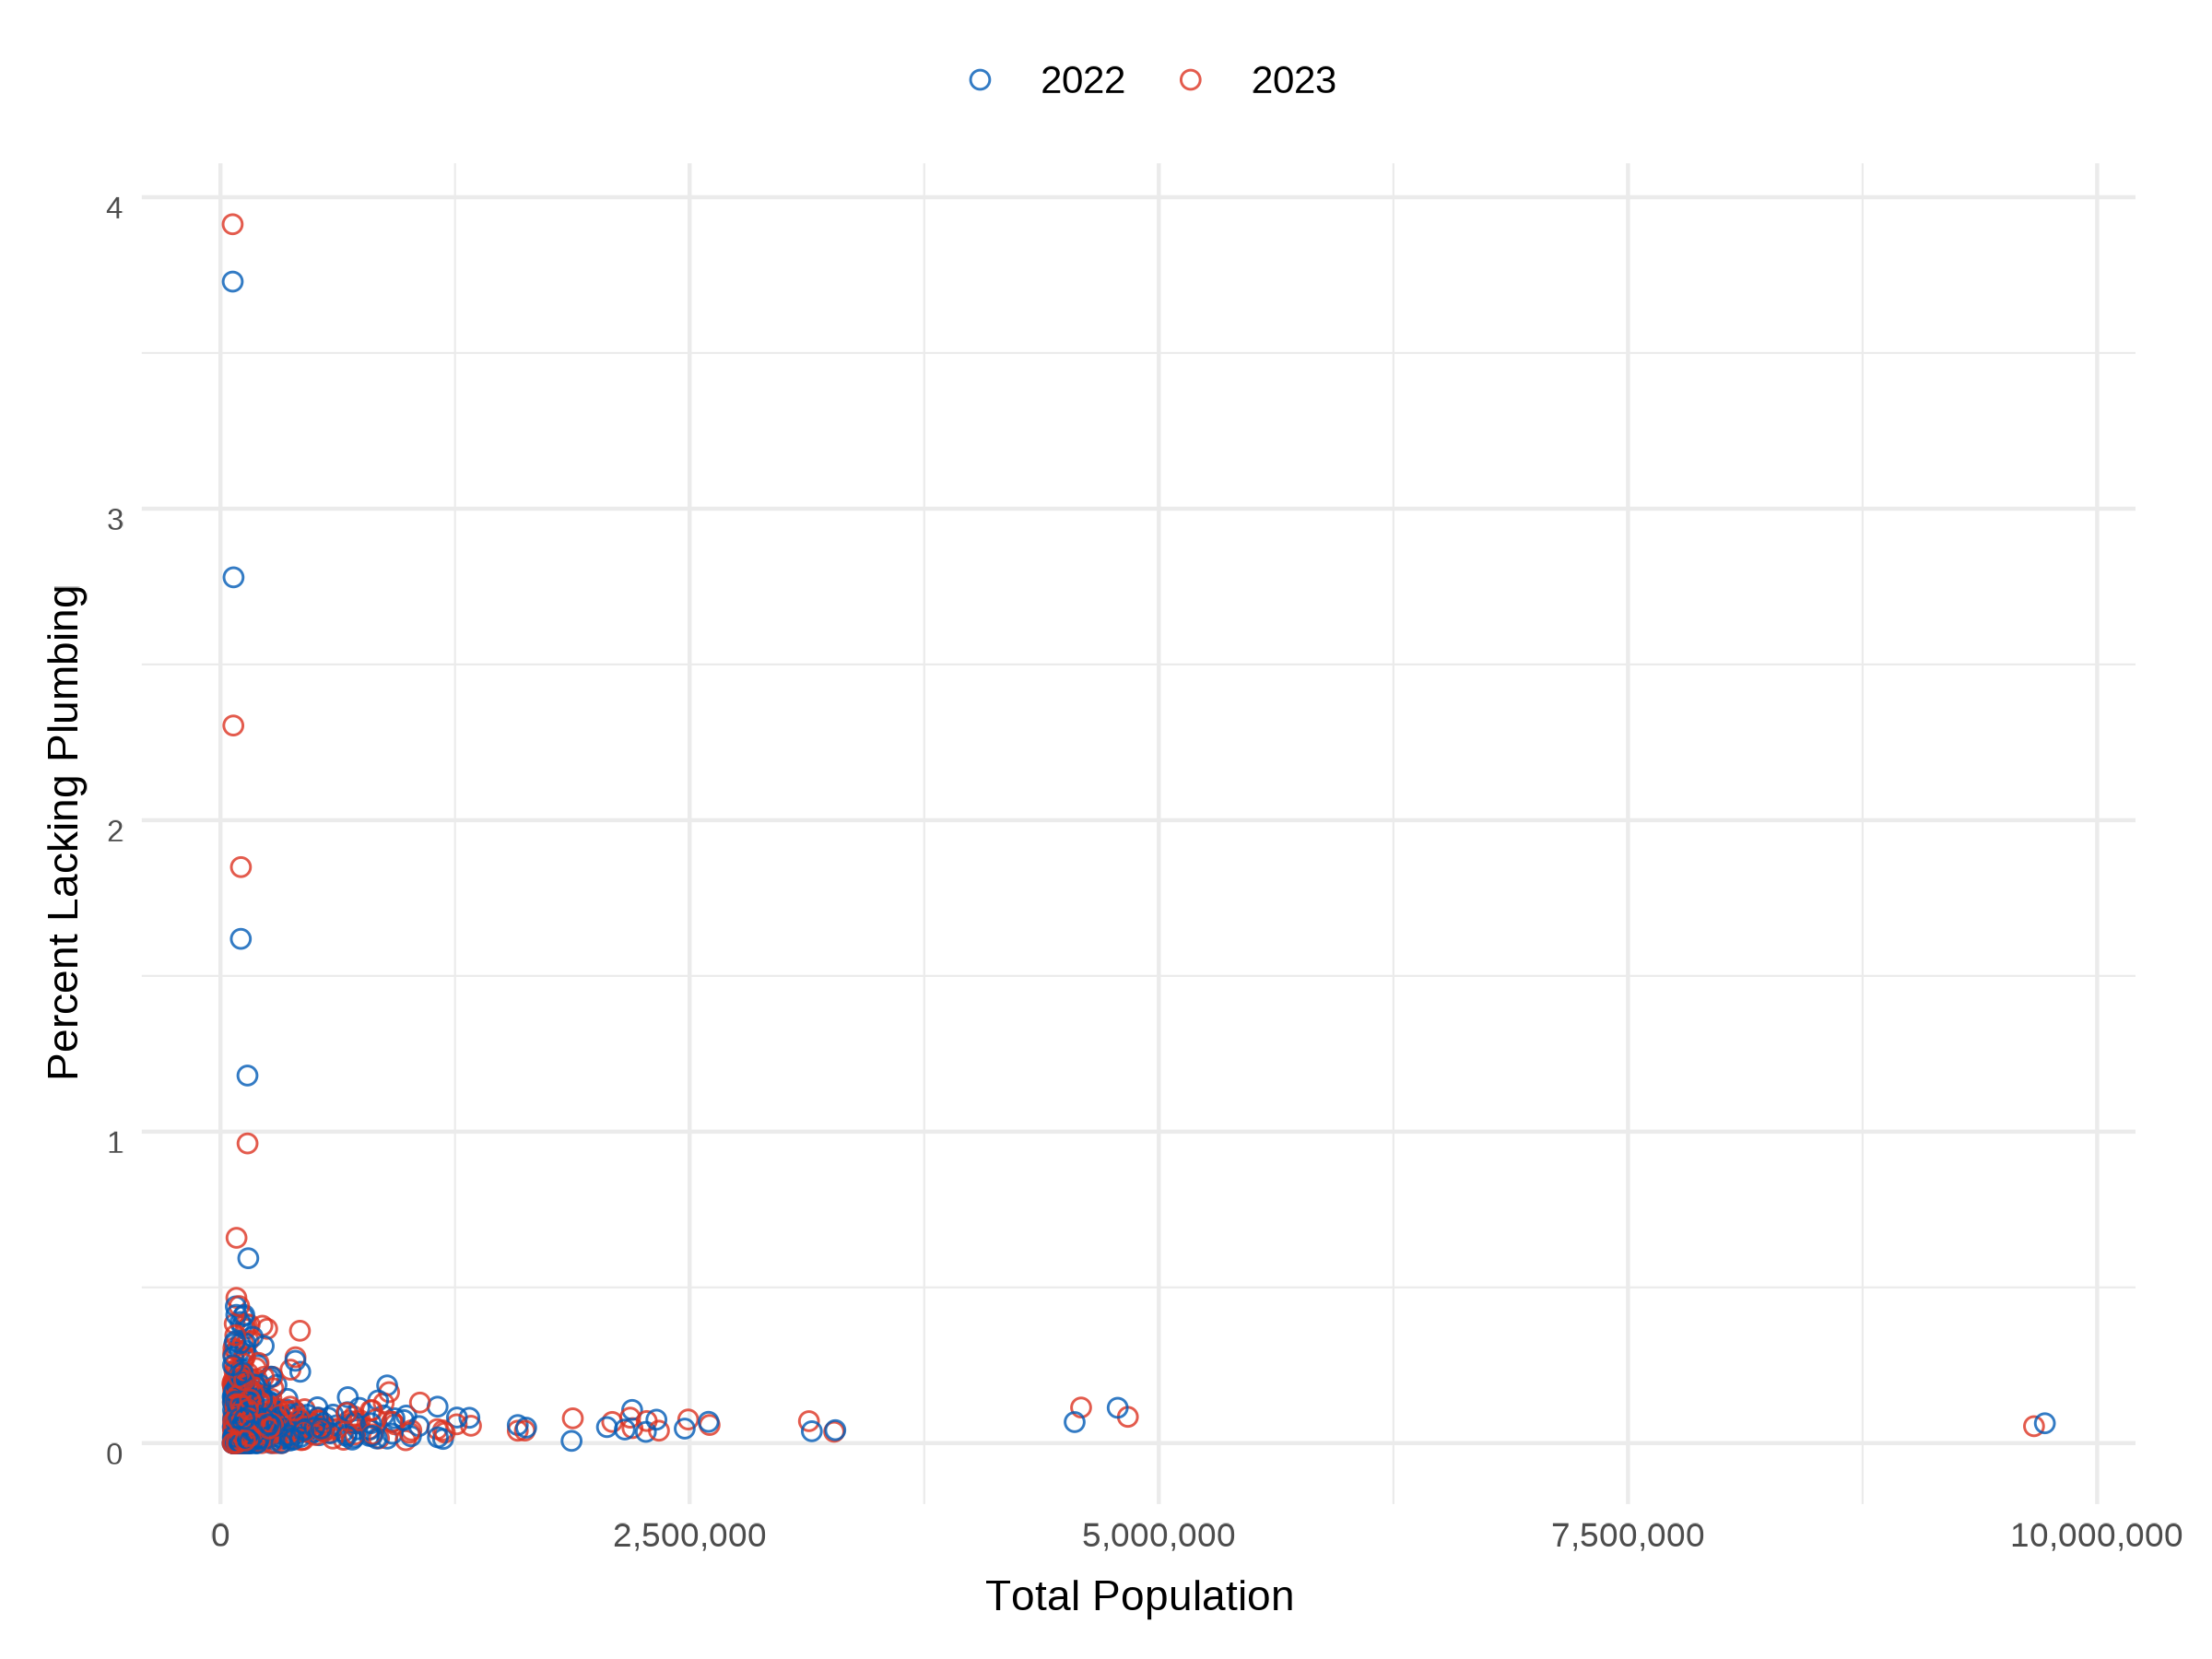
Visualizing total population vs. percent lacking plumbing across counties in the Western U.S.
While the choropleth map gives us a spatial snapshot of where households lack plumbing facilities, it does not provide the full picture. For instance, how population size relates incomplete plumbing. Low levels of incomplete plumbing in a highly populated county could still affect many households, while less populated counties lacking indoor plumbing may represent fewer absolute households.
To explore this let’s plot total population against the percentage of households lacking plumbing using counties in the Western U.S. This scatter plot enables us to identify both highly populated areas that lack plumbing facilities and less well-populated counties with higher relative plumbing insecurity.
library(scales) # For customizing plot labels
library(plotly) # For interactive chart
library(glue) # For pasting expressions

western_data_2023_2022 <- western_data_2023_wide |> # combine 2023 & 2022 data
  st_drop_geometry() |>  # Remove geometry columns, keeping only attribute data
  select( # Select relevant columns
    name,
    total_pop,
    percent_lacking_plumbing
  ) |>
  rename(
    percent_lacking_plumbing_2023 = percent_lacking_plumbing,
    total_pop_2023 = total_pop
  ) |>
  left_join(
    western_data_2022_wide |> # Join with the 2022 data
      st_drop_geometry() |> # Remove geometry columns from 2022 data
      select( # Select relevant columns from 2022 data
        name,
        total_pop,
        percent_lacking_plumbing
      ) |>
      # Rename columns
      rename(percent_lacking_plumbing_2022 = percent_lacking_plumbing,
             total_pop_2022 = total_pop),
    by = "name"  # Specify the joining by county name
  ) |>
  drop_na() |>  # Remove rows with any NA values in the data
  mutate( # Create new columns to extract state and county names
    state = str_extract(name, "(?<=, ).*"), # Extract the state name using regex
    county = str_extract(name, ".*(?=, )") # Extract the county name using regex
  )

# Transform the 2023 and 2022 data from wide to long format
western_data_2023_2022_long <- western_data_2023_2022 |>
  pivot_longer( # Identify columns starting with 'percent_lacking_plumbing_'
    cols = starts_with("percent_lacking_plumbing_"),
    names_to = "year", # Name the new column for year information
    values_to = "percent_lacking_plumbing") |> # Name the new column for plumbing %
  mutate(
    # Map the year names to numeric values (2023 or 2022)
    year = ifelse(year == "percent_lacking_plumbing_2023", 2023, 2022)
  ) |>
  pivot_longer(
    cols = starts_with("total_pop_"), # Identify columns starting with 'total_pop_'
    names_to = "pop_year", # Name the new column for population year information
    values_to = "total_pop" # Name the new column for total population values
  ) |>
  filter(
    # Keep rows where the population year matches the plumbing year
    (pop_year == "total_pop_2023" & year == 2023) |
      (pop_year == "total_pop_2022" & year == 2022)
  ) |>
  select(-pop_year) # Remove the 'pop_year' column, as it's no longer needed

# Create scatter plot
p <- ggplot(
  western_data_2023_2022_long,
  aes(
    x = total_pop,
    y = percent_lacking_plumbing,
    color = factor(year)
  )
) +
  geom_point(size = 2, stroke = 0.5, shape = 21, fill = NA, alpha = 0.8) +
  labs(
    x = "Total Population",
    y = "Percent Lacking Plumbing",
    color = NULL # Remove legend title
  ) +
  theme_minimal() +
  scale_x_continuous(
    labels = scales::comma
  ) +
  scale_color_manual(
    # Custom colors for 2022 and 2023
    values = c("2022" = "#005AB5",
               "2023" = "#DC3220")
  ) +
  theme(
      axis.text.y = element_text(size = 8,
                                 hjust = 1, vjust = 1),
      axis.title.x = element_text(vjust = -1),
      axis.title.y = element_text(vjust = 2),
      # Move legend to the top
      legend.position = "top",
      # Make legend horizontal
      legend.direction = "horizontal",
      # Remove legend title (optional)
      legend.title = element_blank(),
      # Adjust margin to bring it closer to the title
      legend.margin = margin(t = -5),
      # Increase legend text size
      legend.text = element_text(size = 10),
      legend.key.size = unit(1.5, "lines"),
      # Plot margin spacing
      plot.margin = margin(t = 15, r = 20, b = 15, l = 15, unit = "pt")
  )
Highlighting use cases associated with water insecurity in the Western U.S.
Using tidycensus, we can make use of U.S. Census Bureau data to plot various variables such as population, age, education, income, and more. With our recent release “Unequal access to water: How societal factors shape vulnerability to water insecurity
”, we highlight various vulnerability indicators across the Western states that are related to water insecurity using the tidycensus package. This website highlights recent research “Social Vulnerability and Water Insecurity in the Western United States: A Systematic Review of Framings, Indicators, and Uncertainty
” that finds certain demographic traits and socioeconomic circumstances, along with increased hazard exposures, make some people more susceptible to water insecurity than others. Specifically, indicators such as household sizes, Hispanic populations, disabled populations, income inequalities, and renter disparities are all factors associated with water insecurity in the Western U.S. For example, literature showed indicators of household size, female-headed households, female population, and percentage of females in the labor force were all predominantly positively related and influential to water insecurity conditions (Drakes et al., 2024)
.
Takeaways
tidycensus allows us to pull, process, and visualize census data from the U.S. Census Bureau’s API, including Decennial Census data and American Community Survey (ACS) data. The package allows us to seamlessly work with associated R packages such as tidyverse, sf, and tigiris as displayed above. By visualizing census data, we can create informative maps and charts that reveal patterns and disparities across different states and regions, helping to inform research, water-resource partners, and the public.
Additional resources
View tidycensus developers’, Kyle Walker and Matt Herman, website
to learn more about additional package functionality and documentation. Check out the book “Analyzing US Census Data: Methods, Maps, and Models in R
”, by Kyle Walker, for additional information on wrangling, modeling, and analyzing U.S. Census data. View our site
to learn more about unequal access to water and how this research can inform more equitable water management practices. Additionally, view the code
used to make our open source, reproducible website here.
References
Azadpour E, Carr AN, Clarke A, Drakes O, Restrepo-Osorio DL, Nell C. 2024. Unequal access to water: How societal factors shape vulnerability to water insecurity. U.S. Geological Survey software release. Reston, VA. https://doi.org/10.5066/P19M9WYT .
Drakes, O., Restrepo-Osorio., D.L., Powlen, K.A. and Hines, M.K., 2024, Social vulnerability and water insecurity in the western United States: A systematic review of framings, indicators, and uncertainty, https://doi.org/10.1029/2023WR036284 .
U.S. Census Bureau, 2022, “Tenure by Plumbing Facilities,” American Community Survey, 1-Year Estimates Detailed Tables, Table B25049, accessed on Nov 27, 2024, https://data.census.gov/table?q=B25049&y=2022 .
U.S. Census Bureau, 2022, “Total Population,” American Community Survey, 1-Year Estimates Detailed Tables, Table B01003, accessed on Nov 27, 2024, https://data.census.gov/table?q=B01003&y=2022 .
U.S. Census Bureau, 2023, “Tenure by Plumbing Facilities,” American Community Survey, 1-Year Estimates Detailed Tables, Table B25049, accessed on Nov 27, 2024, https://data.census.gov/table?q=B25049&y=2023 .
U.S. Census Bureau, 2023, “Total Population,” American Community Survey, 1-Year Estimates Detailed Tables, Table B01003, accessed on Nov 27, 2024, https://data.census.gov/table?q=B01003&y=2023 .
Walker K and Herman M. 2024. tidycensus: Load US Census Boundary and Attribute Data as “tidyverse” and “sf”-Ready Data Frames. R package version 1.6.5, https://walker-data.com/tidycensus/ .
Any use of trade, firm, or product names is for descriptive purposes only and does not imply endorsement by the U.S. Government.
Categories:
Related Posts
A map that glows with the vocabulary of water
February 27, 2026
English is the official language and authoritative version of all federal information.
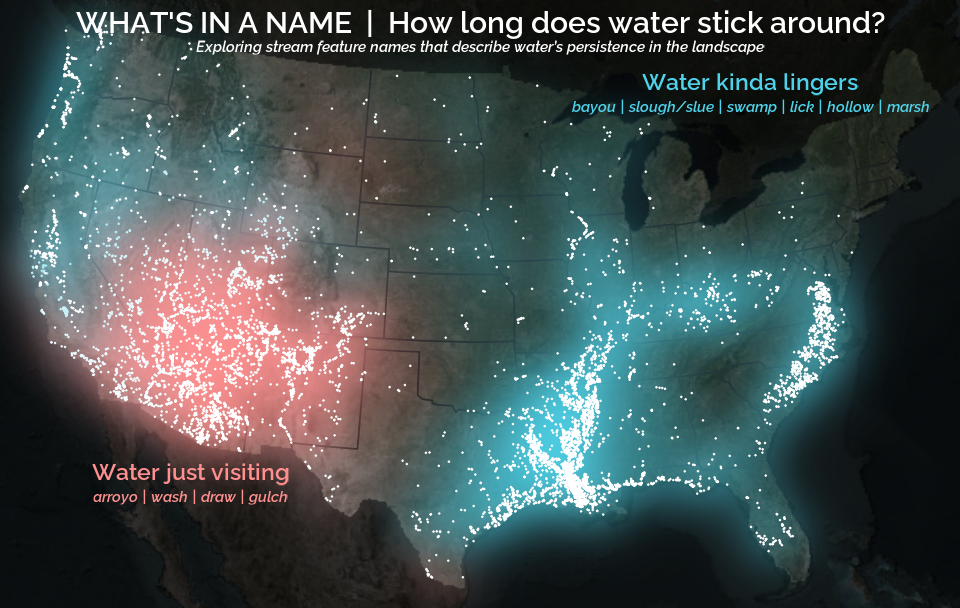
A map that glows with the vocabulary of water
What is your first impression of the map above? To me, it is the shimmer. Thousands of points of light, each one a stream or river, illuminating a darkened basemap. Look closely and a pattern emerges: the country’s waterways form a linguistic constellation. These points are classified not from population data or even explicitly by hydrology. They glow strictly according to the vocabulary used to name them and what can be implied about the hydrology of these streams based on their names.
Extracting the grammar of U.S. stream names
February 27, 2026
English is the official language and authoritative version of all federal information.
Extracting a stream’s feature
The names of streams (hydronyms ) contain, hidden within them, the power to show us the linguistic patterns within the United States. In the United States, stream names tend to follow a binomial structure: a specific name (“Moose,” “Columbia,” “Snake”) paired with a generic feature word (“creek,” “river,” “fork,” “bayou”). The specific portion is endlessly variable, but the generic part is surprisingly stable. In fact, if you look at stream names across the country, the diversity of generic terms is relatively small, but shaped by centuries of hydrologic realities, settlement history, and local tradition.
Easy hydrology mapping with nhdplusTools, geoconnex, and ggplot2
November 28, 2025
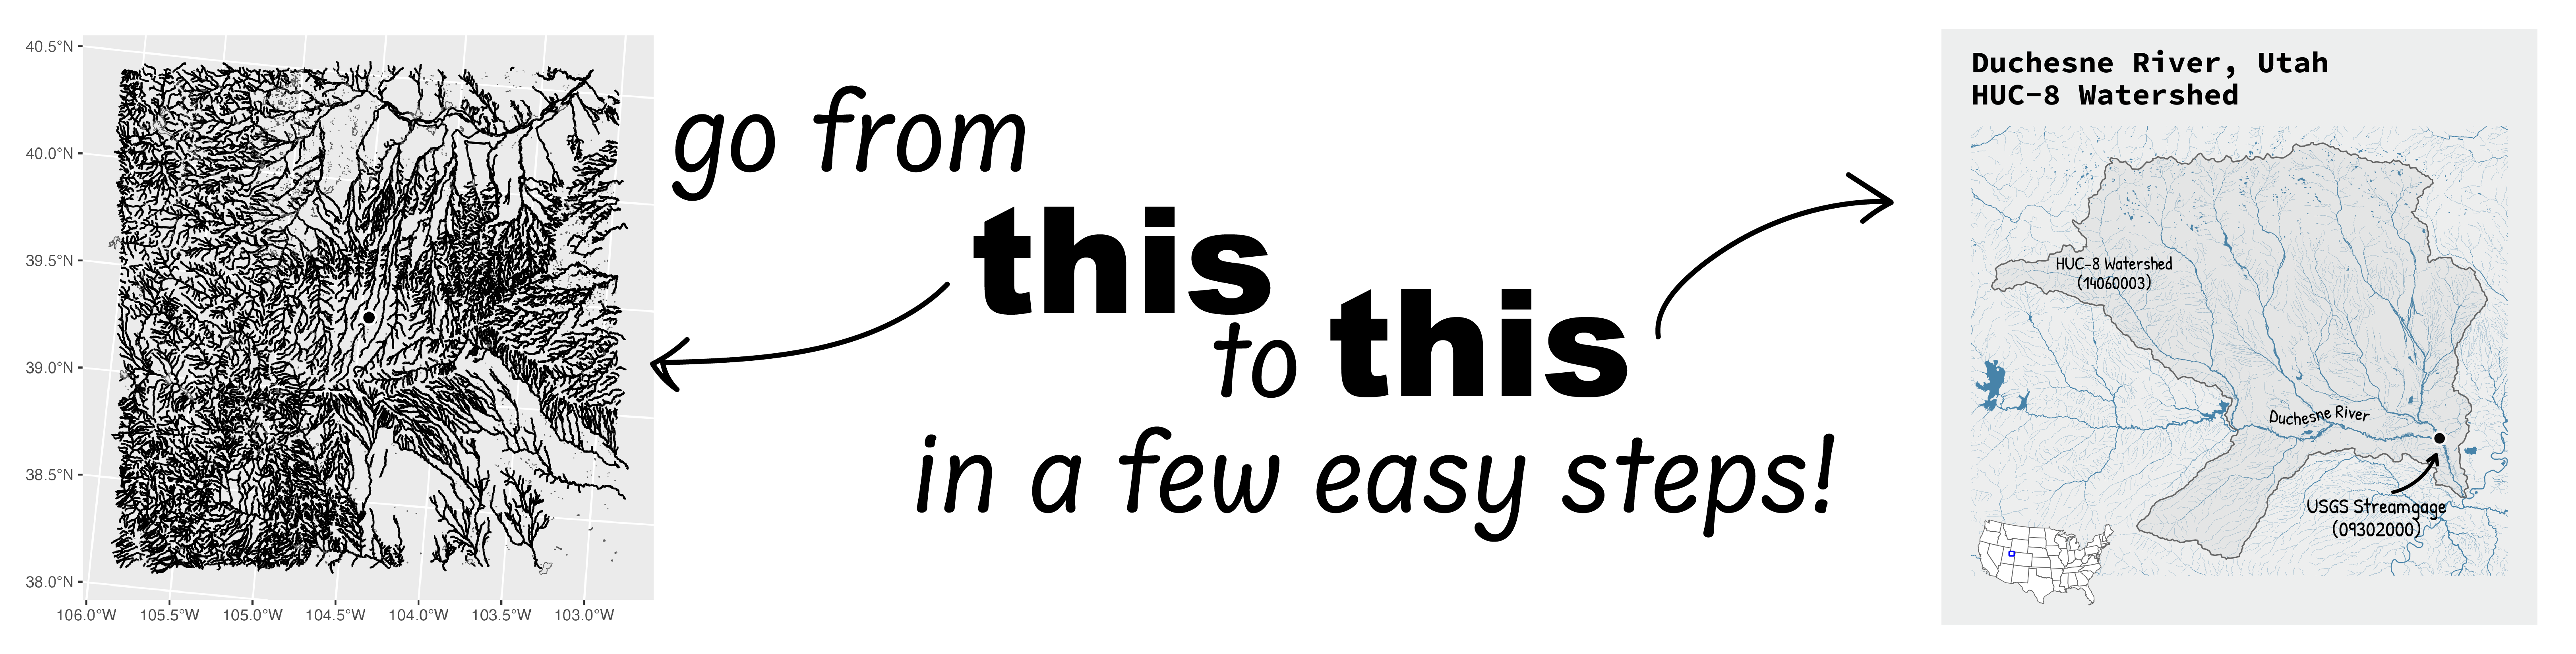
Go from hard-to-read default visuals to easy-to-read river maps in a few easy steps!
Charting 'tidycensus' data with R
June 24, 2025
In January, 2025, the organizers of the tidytuesday challenge highlighted data that were featured in a previous blog post and data visualization website . Some of us in the USGS Vizlab wanted to participate by creating a series of data visualizations showing these data, specifically the metric “households lacking plumbing.” This blog highlights our data visualizations inspired by the tidytuesday challenge as well as the code we used to create them, based on our previous software release on GitHub .
Duplicating Quarto elements with code templates to reduce copy and paste errors
May 20, 2025
Introduction
It is a common situation in data science and analysis: We want to create a series of figures, tables, or summary statistics for a set of data. Maybe we’re studying different species of irises or penguins or the current flow conditions for various streamgages (the example used below), and we want a different summary figure or table for each. One common approach is to write code for one set of the data, such as setting up the graphing parameters in a
ggplotdata visualization or calculating a series of statistics for a single species/streamgage. Then, once happy with that, copying and pasting the code for each entity, modifying the code slightly for each iteration.