An official website of the United States government
Here’s how you know
Official websites use .gov A .gov website belongs to an official government organization in the
United States.
Secure .gov websites use HTTPS A lock (
) or https:// means you’ve safely connected to the .gov website. Share
sensitive information only on official, secure websites.
USGS water data science in 2022
USGS water data science in 2022
Date PostedSeptember 3, 2022Last UpdatedMarch 4, 2026
AuthorJordan S Read
Reading Time11 minutesShare
The USGS water data science branch in 2022
The USGS data science branch advances environmental sciences and water information delivery with data-intensive modeling, data workflows, visualizations, and analytics. A short summary of our history can be found in a prior blog post
. Sometimes I refer to data scientists as experts in wrangling complex data and making it more valuable or usable. I’m writing this blog to update readers on the types of things we’re up to and point out some future changes (including new hiring efforts).
Within the data science branch, we are advocates for open science and build data science solutions that aim to maintain scientific integrity, cost less over the long-run, and are accessible for others to build upon or reuse. We’re also working to expand access, representation, and participation in federal science with past innovative hiring initiatives
(including for data visualization specialists
).
Our data science branch has grown and our capabilities have matured over the years. Now it is time for changes that will contribute to more effective and sustainable work practices by: 1) launching new positions that will create more pathways for leadership and promotion, 2) adding new team structures that will be aligned with our data science sub-disciplines (visualizations, ML, web analytics, and reproducible data assembly), and 3) distributing supervisory responsibilities and vision to team leads.
Below is my current description of what each sub-team does, the current status, and a couple of thoughts on where I think there might be some new opportunities for growth. You may notice I’m using the word may for future plans. This is because I want to empower others (e.g., new supervisors, tech leads, and contributors) to own big parts of the future vision for these capabilities.
What are these capabilities/teams?
Visualizations
Our data visualization sub-team (“Vizlab”) has been around since 2014, but is constantly evolving and added staff this year
. Cee
recently described Vizlab
as “a collaborative team that uses data visualization to communicate water science and data to non-technical audiences. Our mission is to create timely visualizations that distill complex scientific concepts and datasets into compelling charts, maps, and graphics. We operate at the intersection of data science and science communication.” See also Vizlab’s portfolio site.
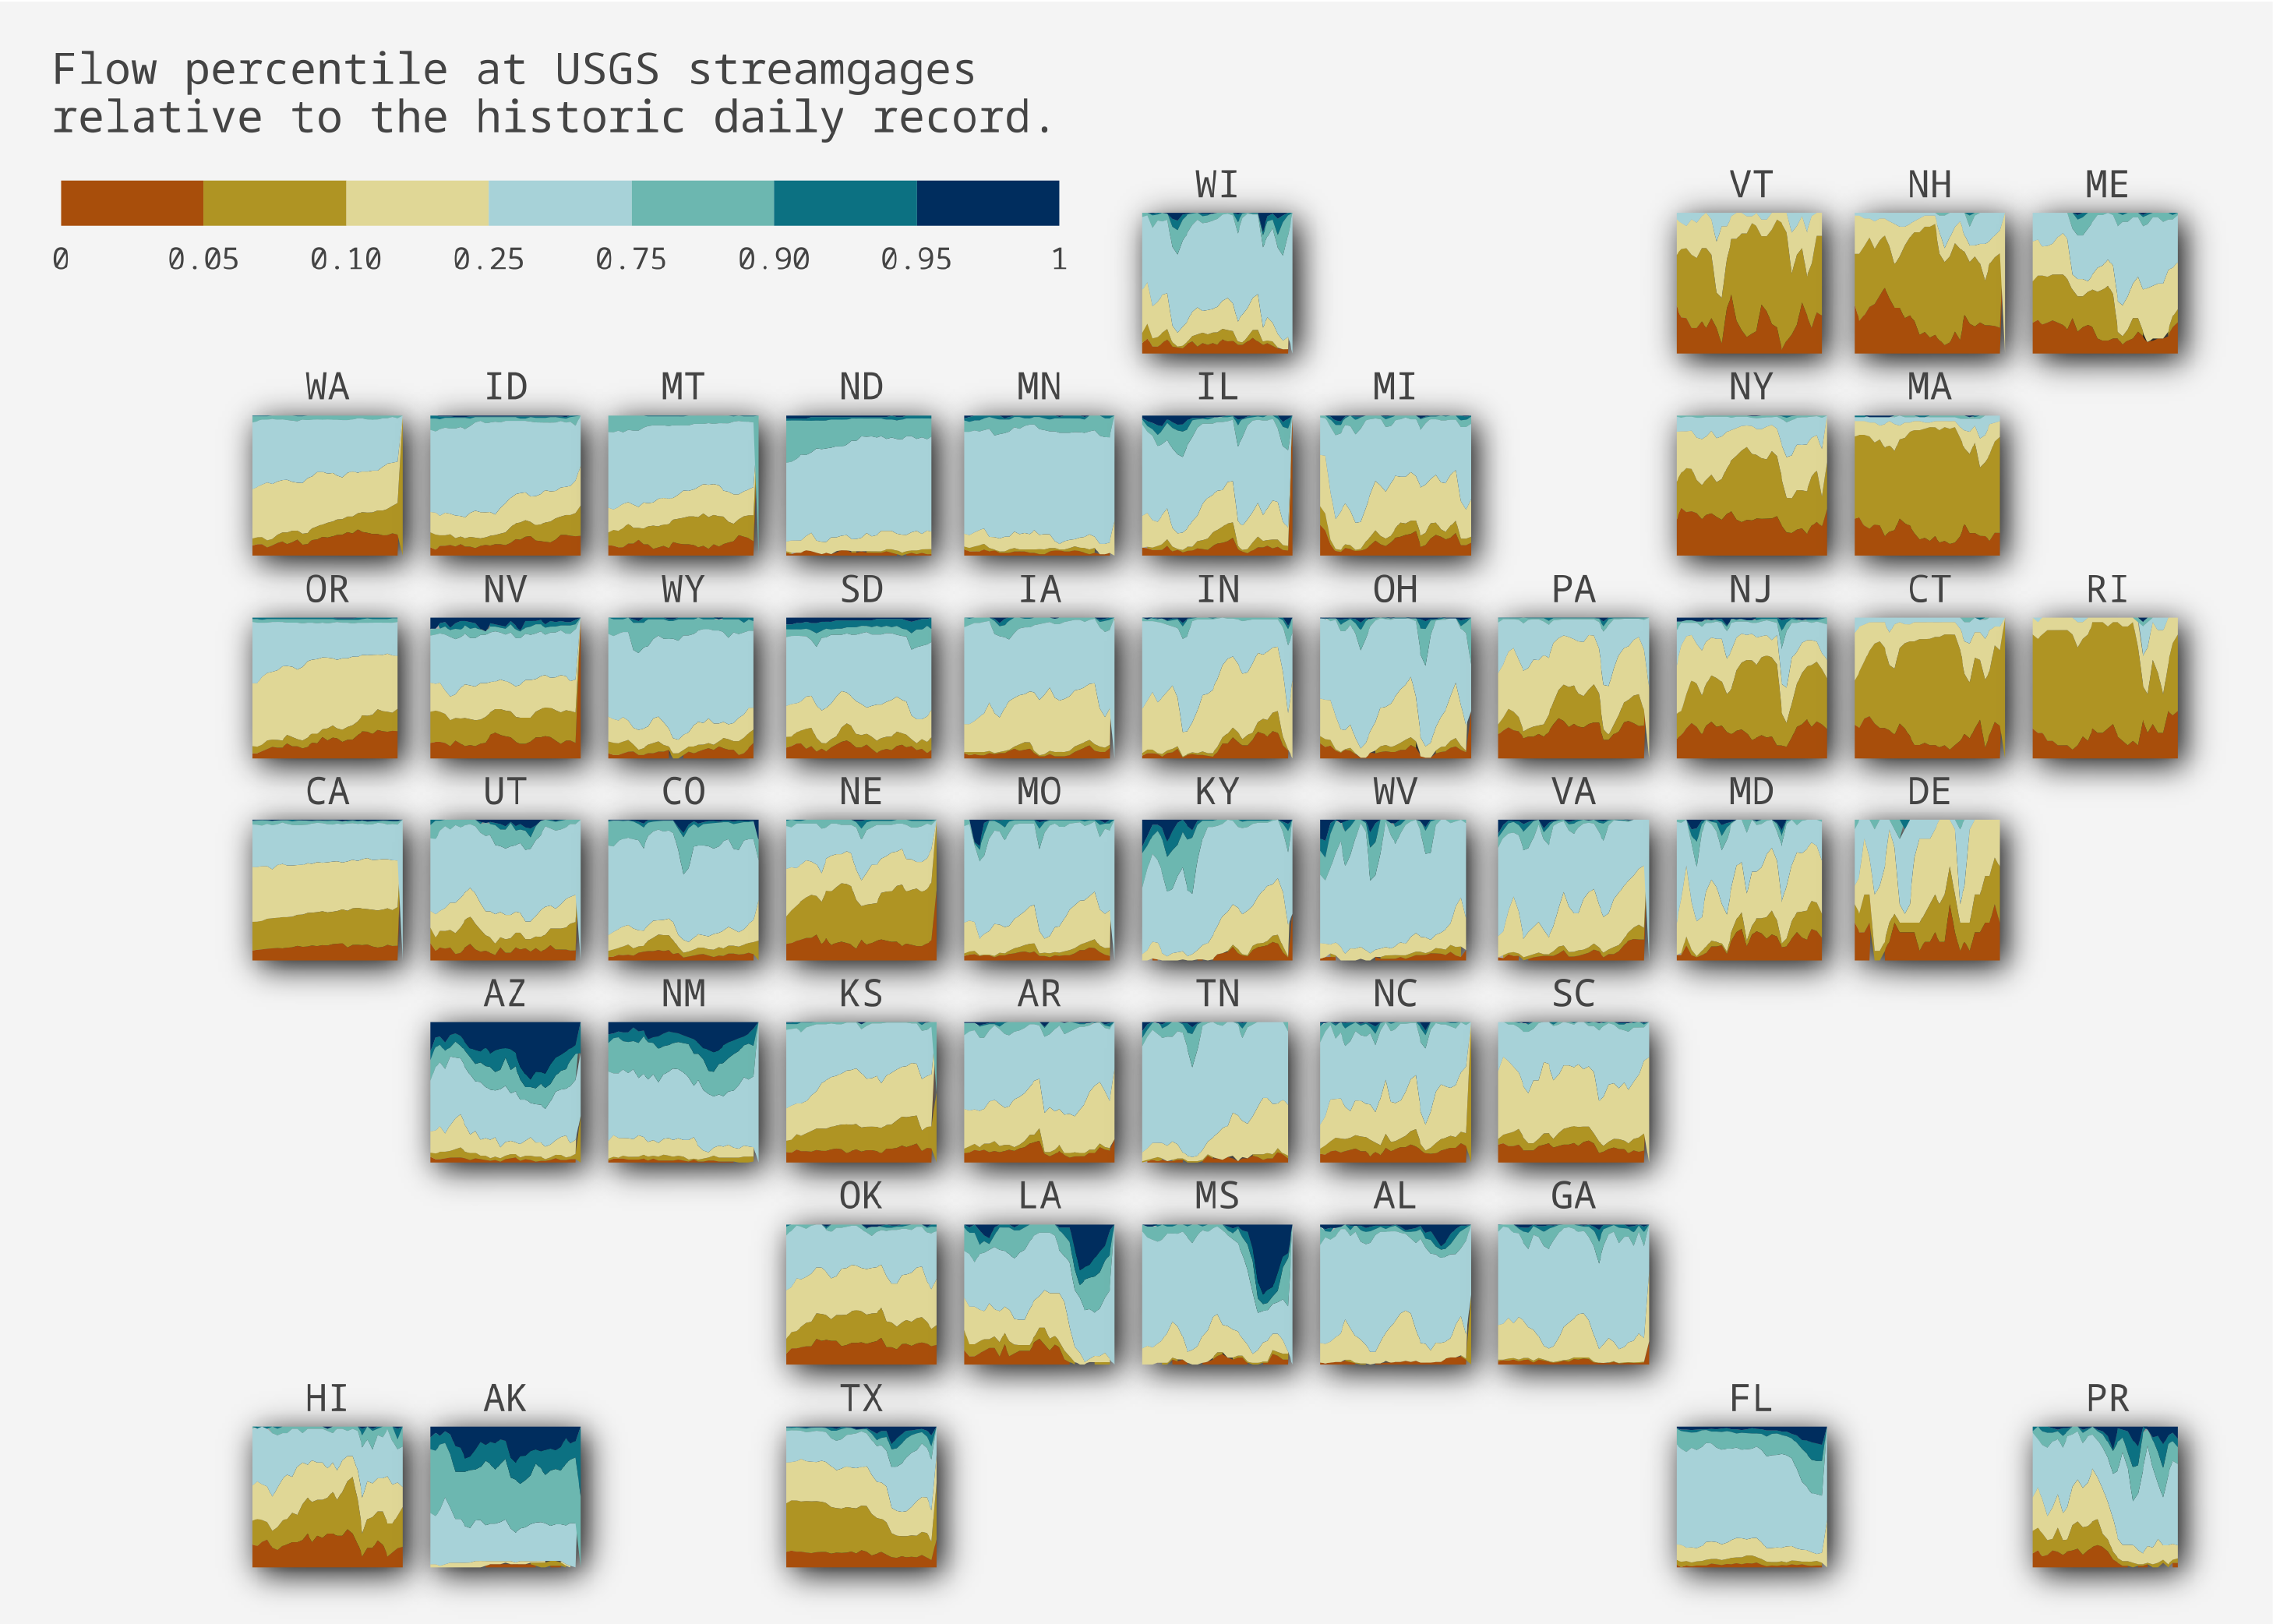
A cartogram map of the US with proportional area charts for each state showing the proportion of streamgages by flow levels for August 2022, categorized using percentile bins. (credit USGS Vizlab)
Vizlab right now includes three full-time federal employees and a mix of part-time contributors. The group excels at producing new visualization content that ranges from social media (e.g., #30DayChartChallenge), complex interactives (e.g., stream temperature in the Delaware River Basin), and storytelling like in “From Snow to Flow”. In addition to communicating about data in fun, accessible ways, Vizlab builds data workflows that make it faster to template or reuse content in the future, such as for recurring event types or seasonal syntheses of water patterns.
Vizlab in the future may provide new leadership in the publication of data visualization code and underlying data. The team already has a strong emphasis on data visualization accessibility and codes in the open, but I wouldn’t be surprised to see more Vizlab authored blog posts that show “how we did it” that help others with a bit of a tutorial on how some of the thorny data, graphics, interactions, or hosting challenges were solved. We’ll have some challenges ahead with code publication as new policies in motion will encourage more open source releases of code while also creating some new processes that we’ll need to navigate. I’m confident the group will continue to innovate with all kinds of approaches to generate interesting products while pushing to make the work more “open” (e.g., stream forecast example on observable
). Additionally, as water research in USGS expands in scale and complexity, I’d bet we’ll see Vizlab author some very compelling new visuals for explaining and exploring patterns in large environmental datasets and I think we’ll see a clear impact of the group on traditional USGS science products including raising the bar on publication figures, visuals, and supplements.
Machine learning
Machine learning (ML) is a rapidly growing capability in the U.S. Geological Survey, and the Water Mission Area is no exception. ML offers a ton of promise for a range of important applications, including improving our ability to predict changes in water quality/quantity as well as more business-oriented decisions, such as improving user experience through our large portfolio of water information web applications and providing early warnings of sensor failures in the field.
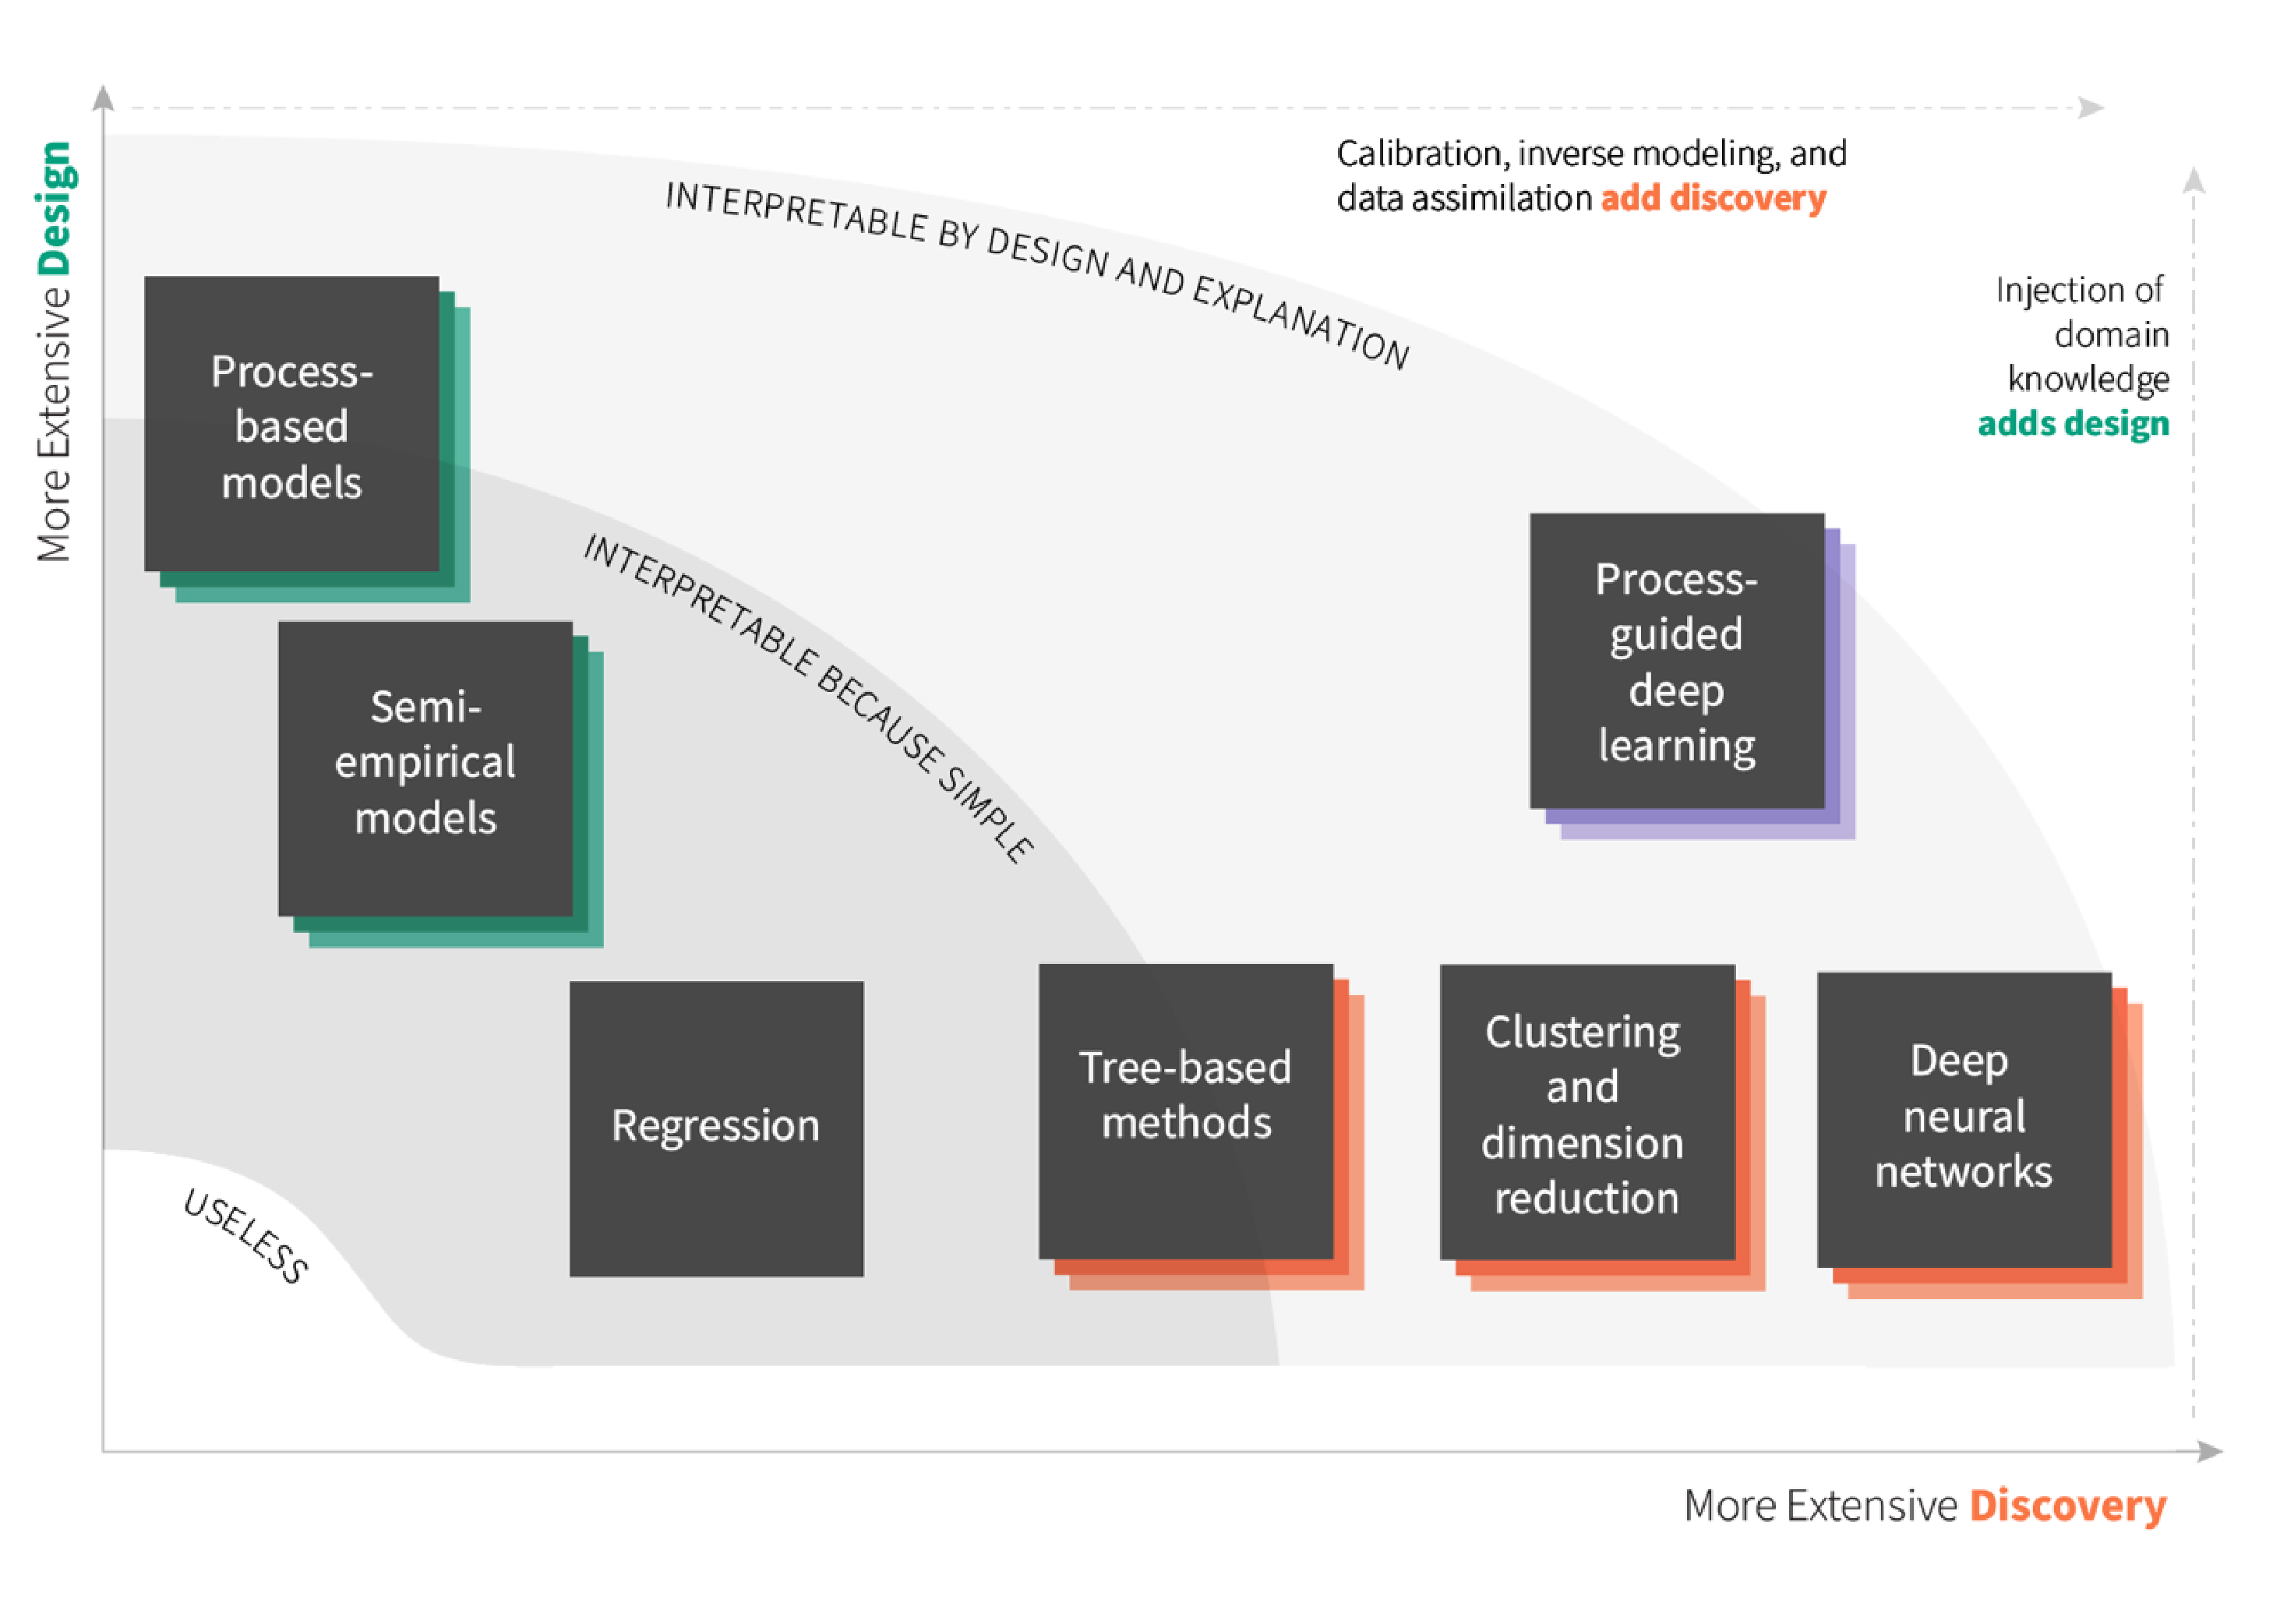
Model types positioned by their use of design and discovery, emphasizing that both can be used together. (credit AP Appling).
Our ML capability right now includes three ML specialist full-time federal employees and an ML postdoc in the data science branch, with three more in our partner "analysis and prediction" branch coming out of our joint hiring effort from last year. The group's current strengths are in temporally- and spatially-aware deep learning approaches to predict water quality changes in streams and rivers, most of which involve adding forms of "process-guidance" to an otherwise purely data-driven model. Alison is providing leadership for the growth of this capability in USGS water, including leading an effort tasked with "building capacity in AI/ML" (AI = artificial intelligence) and authoring a recent comprehensive book chapter on ML for inland waters (see publisher link or non-paywalled preprint, as well as the adjacent figure). Jake and Sam led forecasts for the Delaware River Basin that provide quasi-operational delivery of zero to seven-day-ahead summer water temperatures with innovative ML and data assimilation methods that are described in a companion paper led by Jake.
This crew is also working actively on a strategy document for ML opportunities in USGS water and also exploring methods in explainable AI (XAI), as well as continuing to provide leadership and development in the new field of knowledge-guided machine learning (KGML).
Our data science branch ML sub-team in the future may strive to mature our methods for inference in ML applications and advancing XAI. Given our position in a science agency that places great value on understanding processes at play alongside more accurate prediction goals, it is unlikely to see closed-box (i.e., uninterpretable) approaches gain traction in critical applications. I’d also expect a continued effort to build data and operations (operations = robust, dependable, and deployed for use, but less nimble and exploratory) capabilities that complement ML development efforts. David
moved into a role in ML operations (MLOps) this year, and the need for these skills will grow as projects mature and codes migrate into more operational use-cases. Similarly, efforts in USGS water to build enterprise models will create opportunities to strategically fuse ML and process-based codes in formal model/software development efforts that will require thoughtful architectures and robust implementations. Lastly, as our ML capability spreads to touch on more diverse applications, I wouldn’t be surprised to see more situations of “decision-tuned” predictions where a similar underlying model is subtly re-purposed to deliver parallel data streams for distinct use-cases. For example, training two variants of a model to predict maximum water temperature alongside temperature exposure duration may inform two different decisions with a single model development investment; using a variant of an environmental forecasting model to also provide real-time warning of faulty automated field measurements may result in field visit efficiencies. OK, one more… I think the challenges related to model sharing, model/environment capture, model reuse, and general open science needs for ML models and their associated data prep and computing needs are going to lean on leadership from this sub-team in collaboration with the data assembly sub-team mentioned below.
Web analytics
Our data science branch is situated within the “Integrated Information Dissemination Division” along with the web communications branch and the decision support branch. Our colleagues build lots of web applications
that deliver tons of water data to the public and decision makers. Our web analytics capability is responsible for capturing data on user or machine interactions with these data/information delivery systems and turning it into useful insights that can be used to make decisions that improve these systems or help them reach new audiences. The data we have available include anonymized user interface details (mostly captured via Google Analytics presently) and server logs. The web portfolio within the scope of the analytics capability has tens of millions of unique users each year.
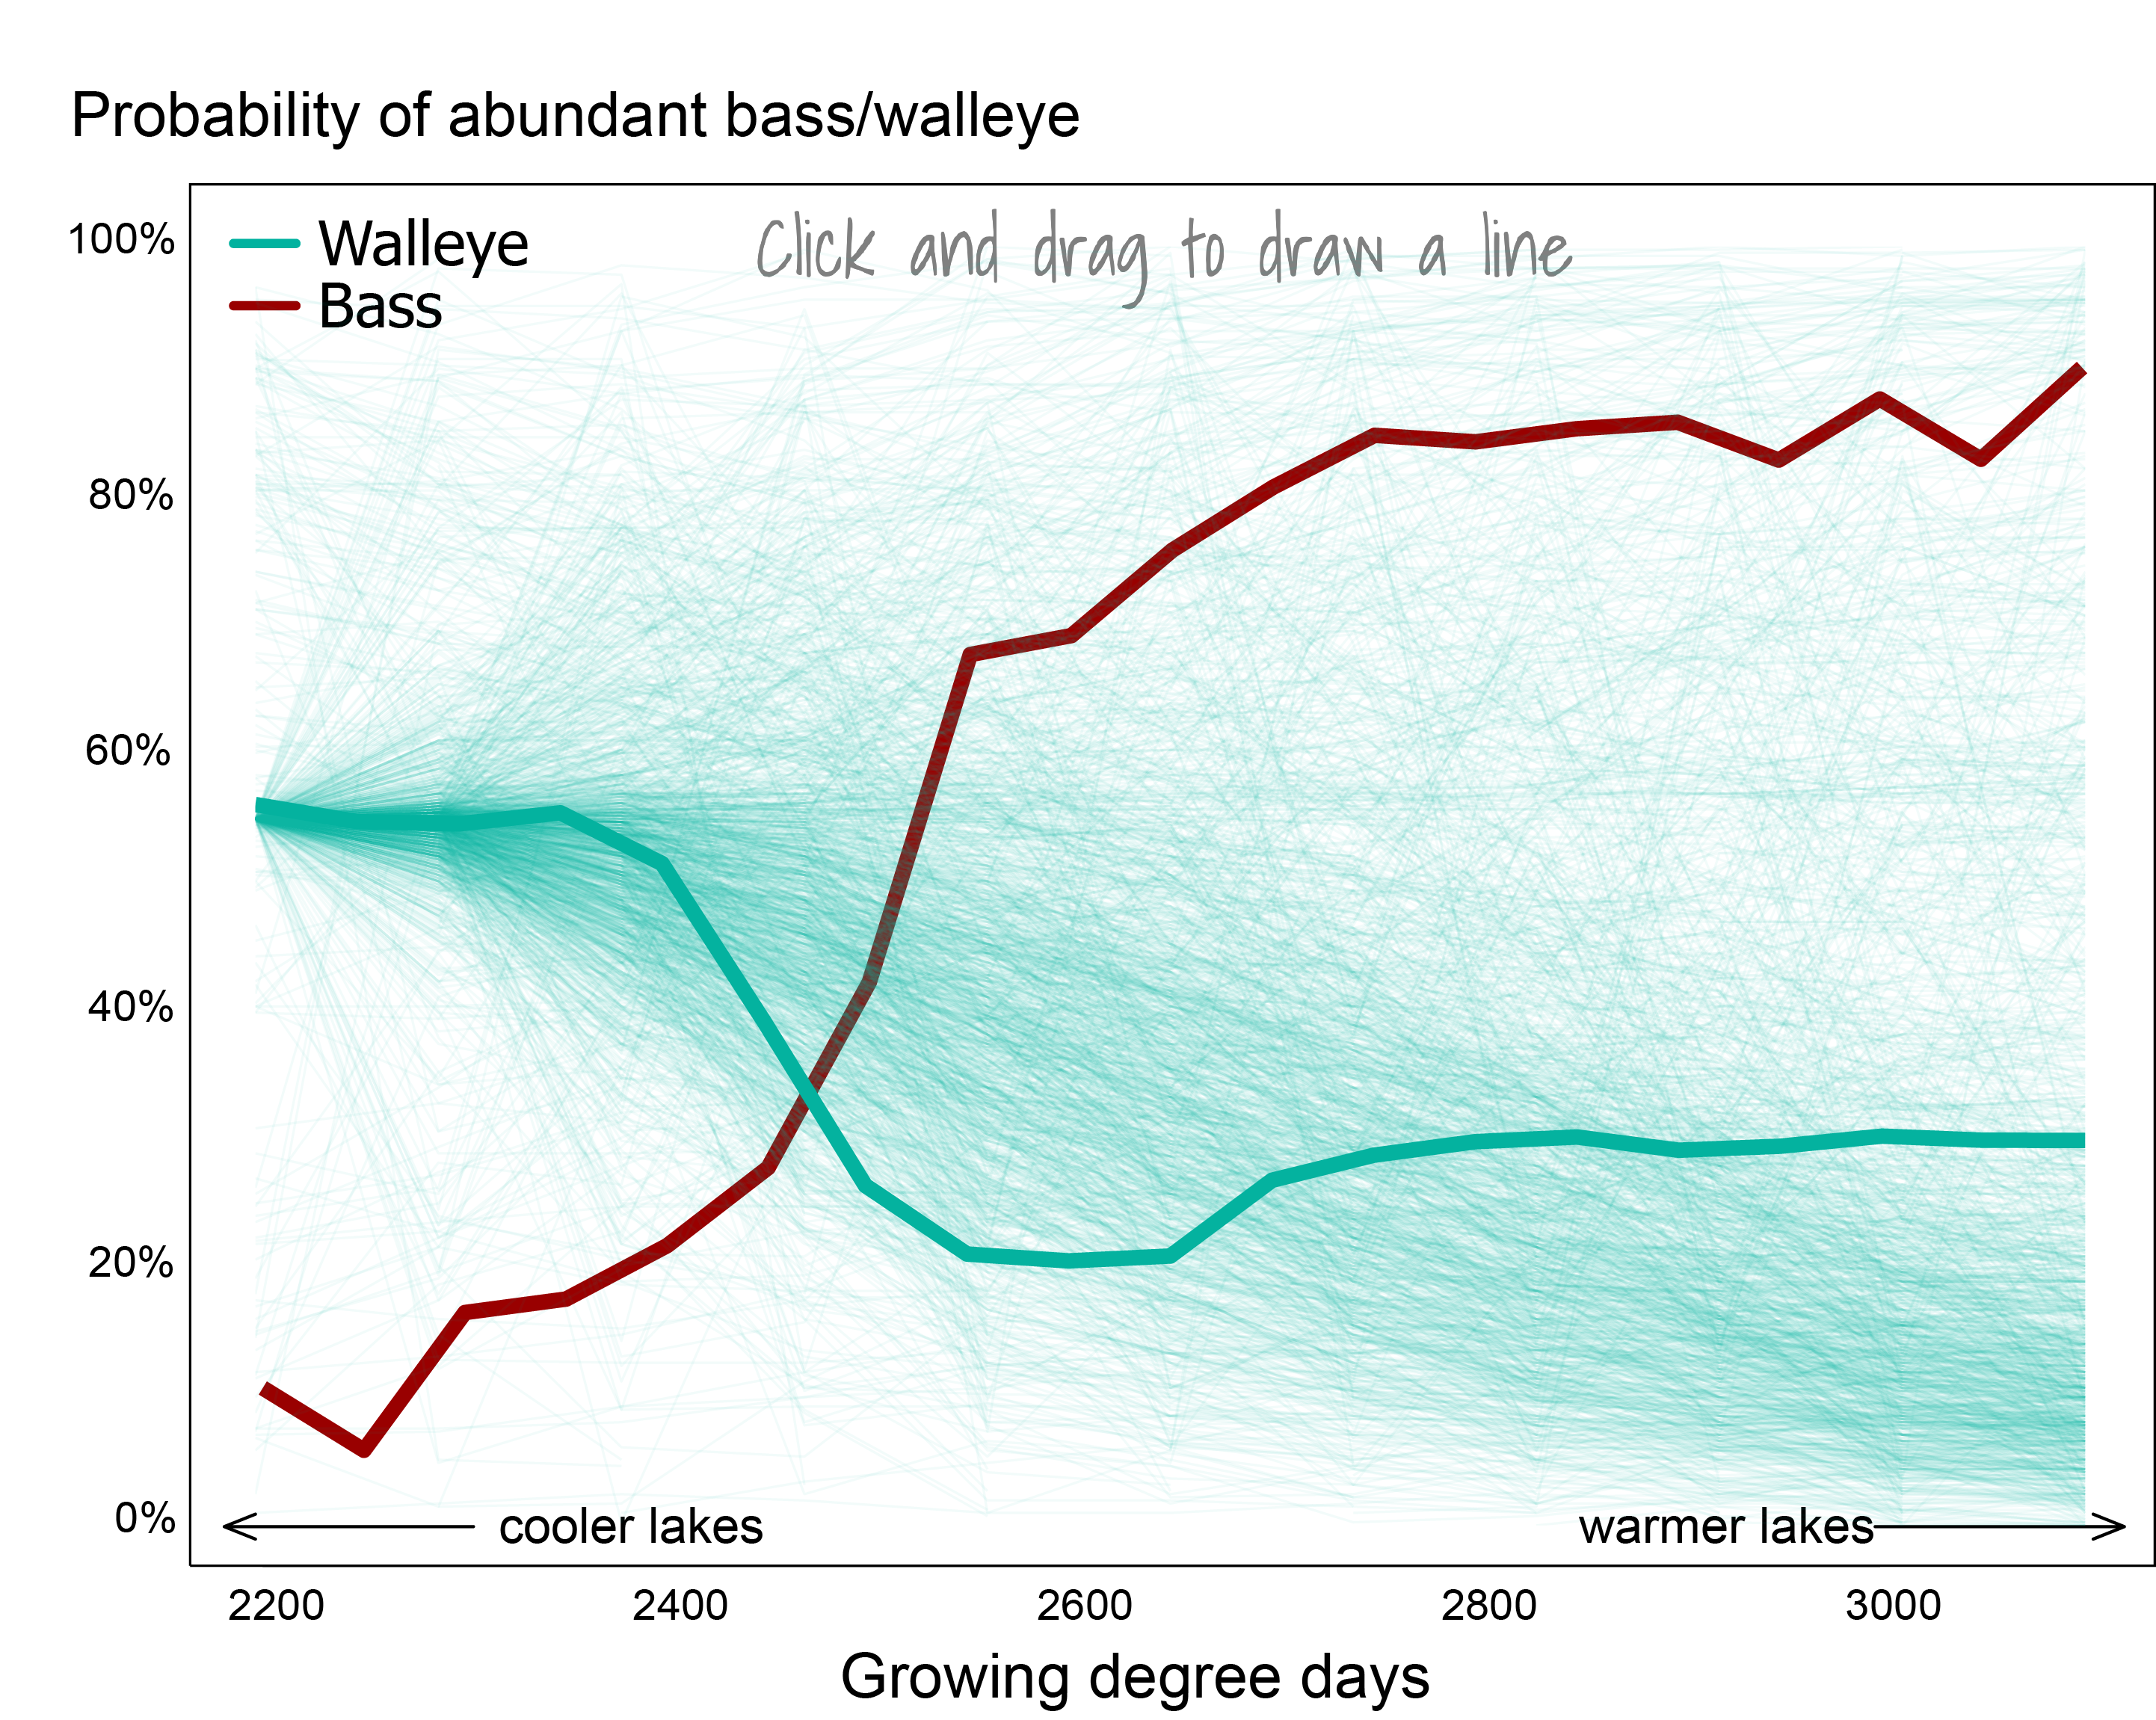
A plot depicting predicted probability of a lake supporting successful walleye reproduction and high largemouth bass abundance as a function of water temperature (growing degree days). Guesses from visitors to the data visualization are overlaid on the original figure. (credit C Nell and JS Read)
Our web analytics sub-team right now includes a few data scientist contributors that primarily work on other projects. We're currently light on staffing but heavy in opportunities for growth in this area. The primary efforts of web analytics right now include development and maintenance of a real-time analytics dashboard that provides access and summarization of patterns and trends in application usage across over four dozen unique web applications. We deliver quarterly reports as part of Congressional communication that provide a view into how much water data is being served (e.g., last quarter there were 1.1 billion requests to USGS water services and 104 billion rows of discrete water quality data served from 2.3 million unique data requests to the multi-agency Water Quality Portal). David led prior work to build data flows that make feed these summaries as well as the analytics dashboard and much of the current work is automated.
Our web analytics sub-team in the future may work more closely with web application development teams in order to build better content for analytics and deliver more value to software development decisions. Analytics has opportunities to work with our information delivery crew and create iterative experiments that can inform agile development (i.e., things that are working for users get promoted, new features that create confusion get reevaluated). This closer partnership would also likely result in better-formed server logs and user interface event tracking that would both support richer analyses, and help us get better at finding and driving business cases for future work. I’d also love to see this capability aligned with measuring targets of new web content we create, and have that feed back into earlier project designs that are more realistic about audience goals and encouraging earlier discussions about end users. I bet we’ll see more partnerships with Vizlab
too, for example in evaluating how users interact with data visualizations through event tracking (see above for a visual on how visitors to our climate+fish viz
guessed on a pattern) and also in how analytics findings are presented. Lastly, we’ve long envisioned that this capability could help us recommend water information products to users to improve the value we provide generally. This kind of thing could be as simple as inferring interest in a state-specific flooding visualization based on a user’s region and visit to similar USGS web content, or could involve real-time modeling of user flows, maybe in collaboration wiht our ML capability, to recommend content in our web footers. Either way, there are some neat collaborative concepts to explore in future analytics efforts.
Reproducible data assembly
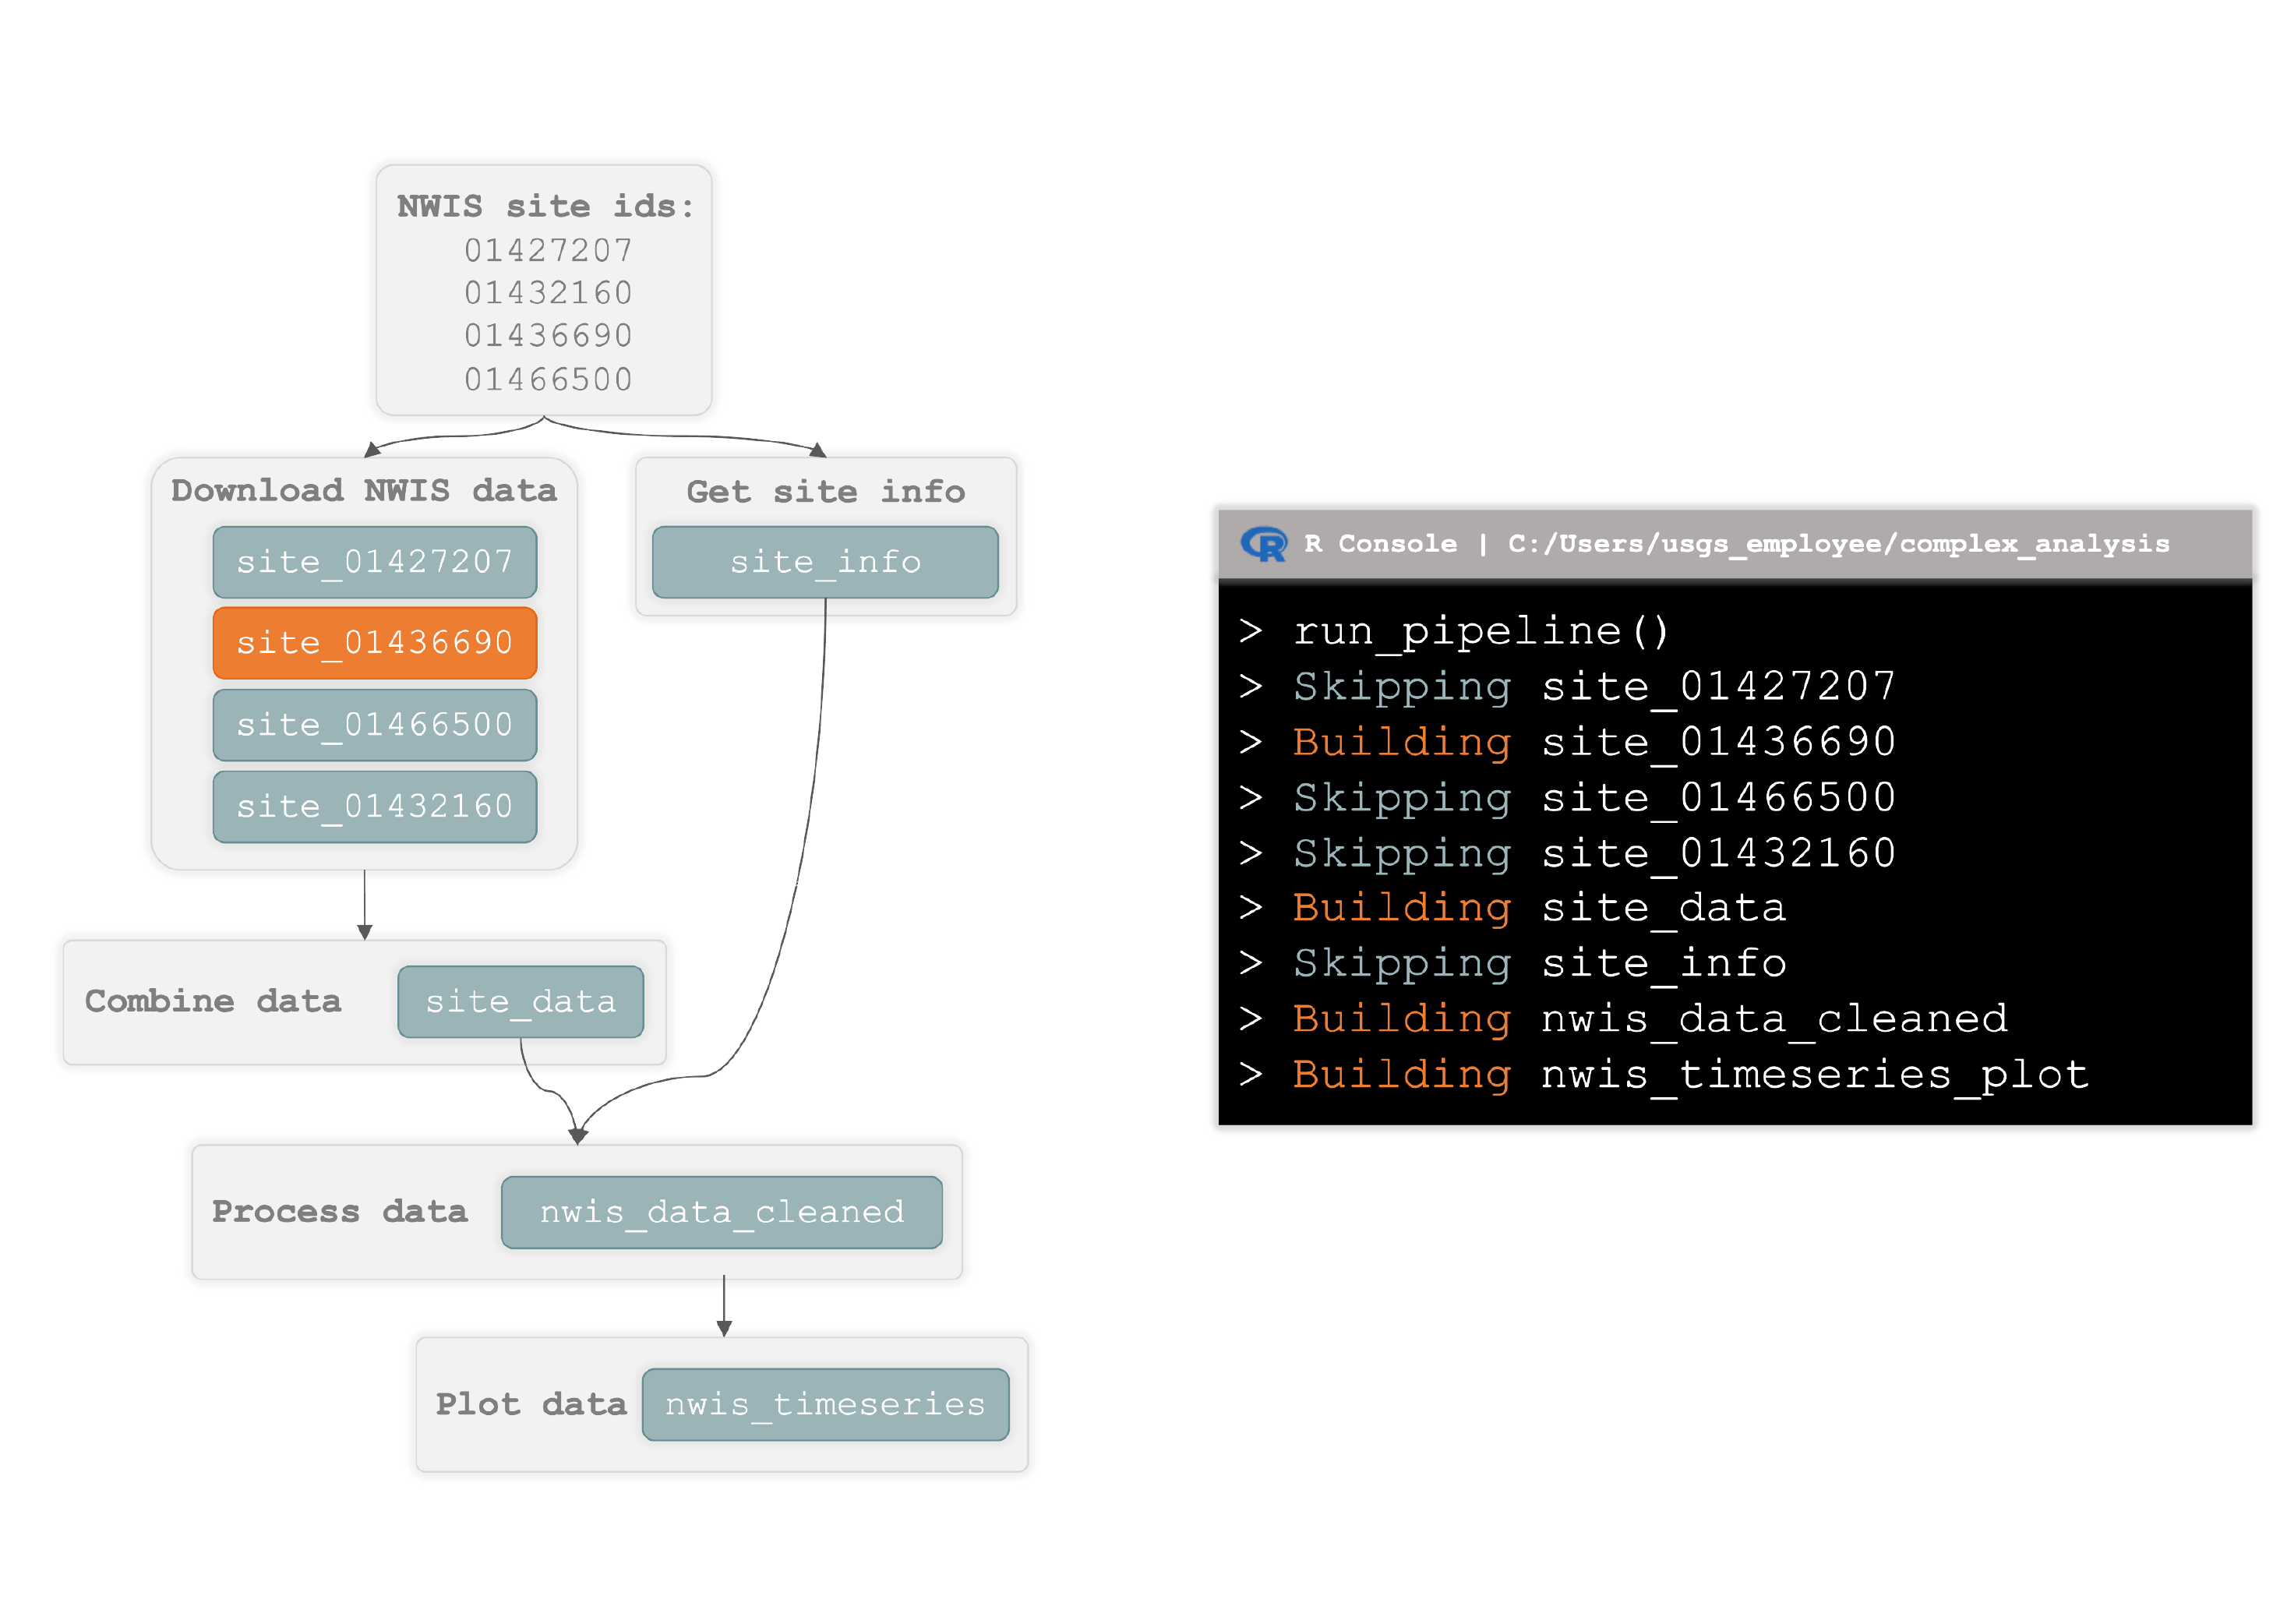
Reproducible data assembly captures the connections between data, code, and results to improve confidence and potential for efficient reuse of data workflows. These data workflows are used to build datasets for models, to orchestrate the running and summarization of models, and/or to create results or visualizations.
Example data assembly pipeline showing how dependencies relate to each other and how the entire pipeline is built within the R environment. NWIS is the National Water Information, which is a water data delivery system created by and maintained by USGS. (image credit L Platt)
Our reproducible data assembly capability right now includes four full-time federal employees in the data science branch, with three more in our partner branches (analysis and prediction; geointelligence) coming out of our joint hiring effort from last year. We build dependency tracking workflows with snakemake in python and targets in R. What "dependency" tracking means in this context is that these tools track whether code or data have changed and rebuild products or outputs that are impacted by those changes while skipping the rebuild of outputs that aren't impacted. In the past, we've used make and remake, and even created our own extension to remake with scipiper but now we primarily use other tools. We have onboarding materials for new staff that include three training modules in targets and one for snakemake. This group currently works a lot on capturing computing environments (e.g., with docker), refining collaborative coding practices, and building efficient published data releases.
Our reproducible data assembly sub-team in the future may move into strengthening the design and usability of USGS data publications and code publications. Right now it is a major win just to be releasing code and data alongside models and papers. In the future, there will likely be a greater emphasis on making these artifacts more useful as building blocks for future science instead of simple captures for reproducibility. Similar to how we use user-centered design
to build information delivery systems that meet real needs, we could employ similar practices to build better outputs from our models and analyses that are more accessible and usable by others. I also see opportunities to build more efficient project workflows that meet a wider number of collaborators where they are with their own coding practices. We’ve used “tiers of reproducibility” in the past to communicate different levels of code/data capture. And a similar spectrum could apply to the selection of technical solutions we bring or recommend to projects to meet needs, such as scripting for groups that are just starting to hop into coding and containerization or for others who are ready to make a jump into portability and environment capture. The needs for this type of capability are so ubiquitous and yet diverse; we’ll need to find ways to elevate lots of different kinds of data work by operating at different technical levels, with different languages, and with varied data scales and complexities.
How we’re going to hire in the near-term
Step one: We’re going to hire supervisors very soon (positions open on September 12th
) that will provide new leadership and vision to these capabilities.
Step two: We will be making a cluster hire for individual contributors to meet needs with permanent federal hires (early 2023).
Step three: Future group hire for technical/process lead positions that will provide leadership of core concepts or capabilities (early to late 2023).
Thanks to Althea
for helping put this post together!
Any use of trade, firm, or product names is for descriptive purposes only and does not imply endorsement by the U.S. Government.
Where the USGS Water Data Science Branch is headed in 2021
It is an exciting time to be a data science practitioner in environmental science. In the last five years, we’ve seen massive data growth, modeling improvements, new more inclusive definitions of “impact” in science, and new jobs and duties. The title of “data scientist” has even been formally added as a job role
by the federal government and there are all kinds of data science needs spelled out in the new USGS science plan
.
Large Data Pulls from Water Quality Portal - A Pipeline-Based Approach
September 27, 2022
Background
The Water Quality Portal (WQP
)
database aggregates and standardizes discrete water quality data from
numerous federal, state, tribal, and other monitoring agencies. The WQP
enables the access and retrieval of over 297,000,000 water quality
records (Read et al. 2017) through web services and an application
programming interface (API) that can be called programmatically using
the
dataRetrieval
package in R. Downloading data from the WQP represents a common pattern
across USGS data teams.
Hydrologic Analysis Package (HASP) Available to Users
July 26, 2022
A new R computational package was created to aggregate and plot USGS
groundwater data, providing users with much of the functionality
provided in Groundwater Watch and the Florida Salinity
Mapper
. The Hydrologic Analysis
Package (HASP)
can retrieve
groundwater level and groundwater quality data, aggregate these data,
plot them, and generate basic statistics. Documentation is available in R
or online
, and users can also
launch a Shiny Application from within the package to generate images in
an interactive user interface.
Large sample pulls using dataRetrieval
July 26, 2022
dataRetrieval is an R package that provides user-friendly access to
water data from either the Water Quality Portal (WQP) or the National
Water Information Service (NWIS). dataRetrieval makes it easier for a
user to download data from the WQP or NWIS and convert it into usable
formats.
Large, parallel deep learning experiments using Snakemake
April 19, 2022
A paper we wrote
was recently published!
In the paper we had to run and evaluate many DL model runs.
This post is all about how we automated these model runs and executed them in parallel using the workflow management software, Snakemake
.