
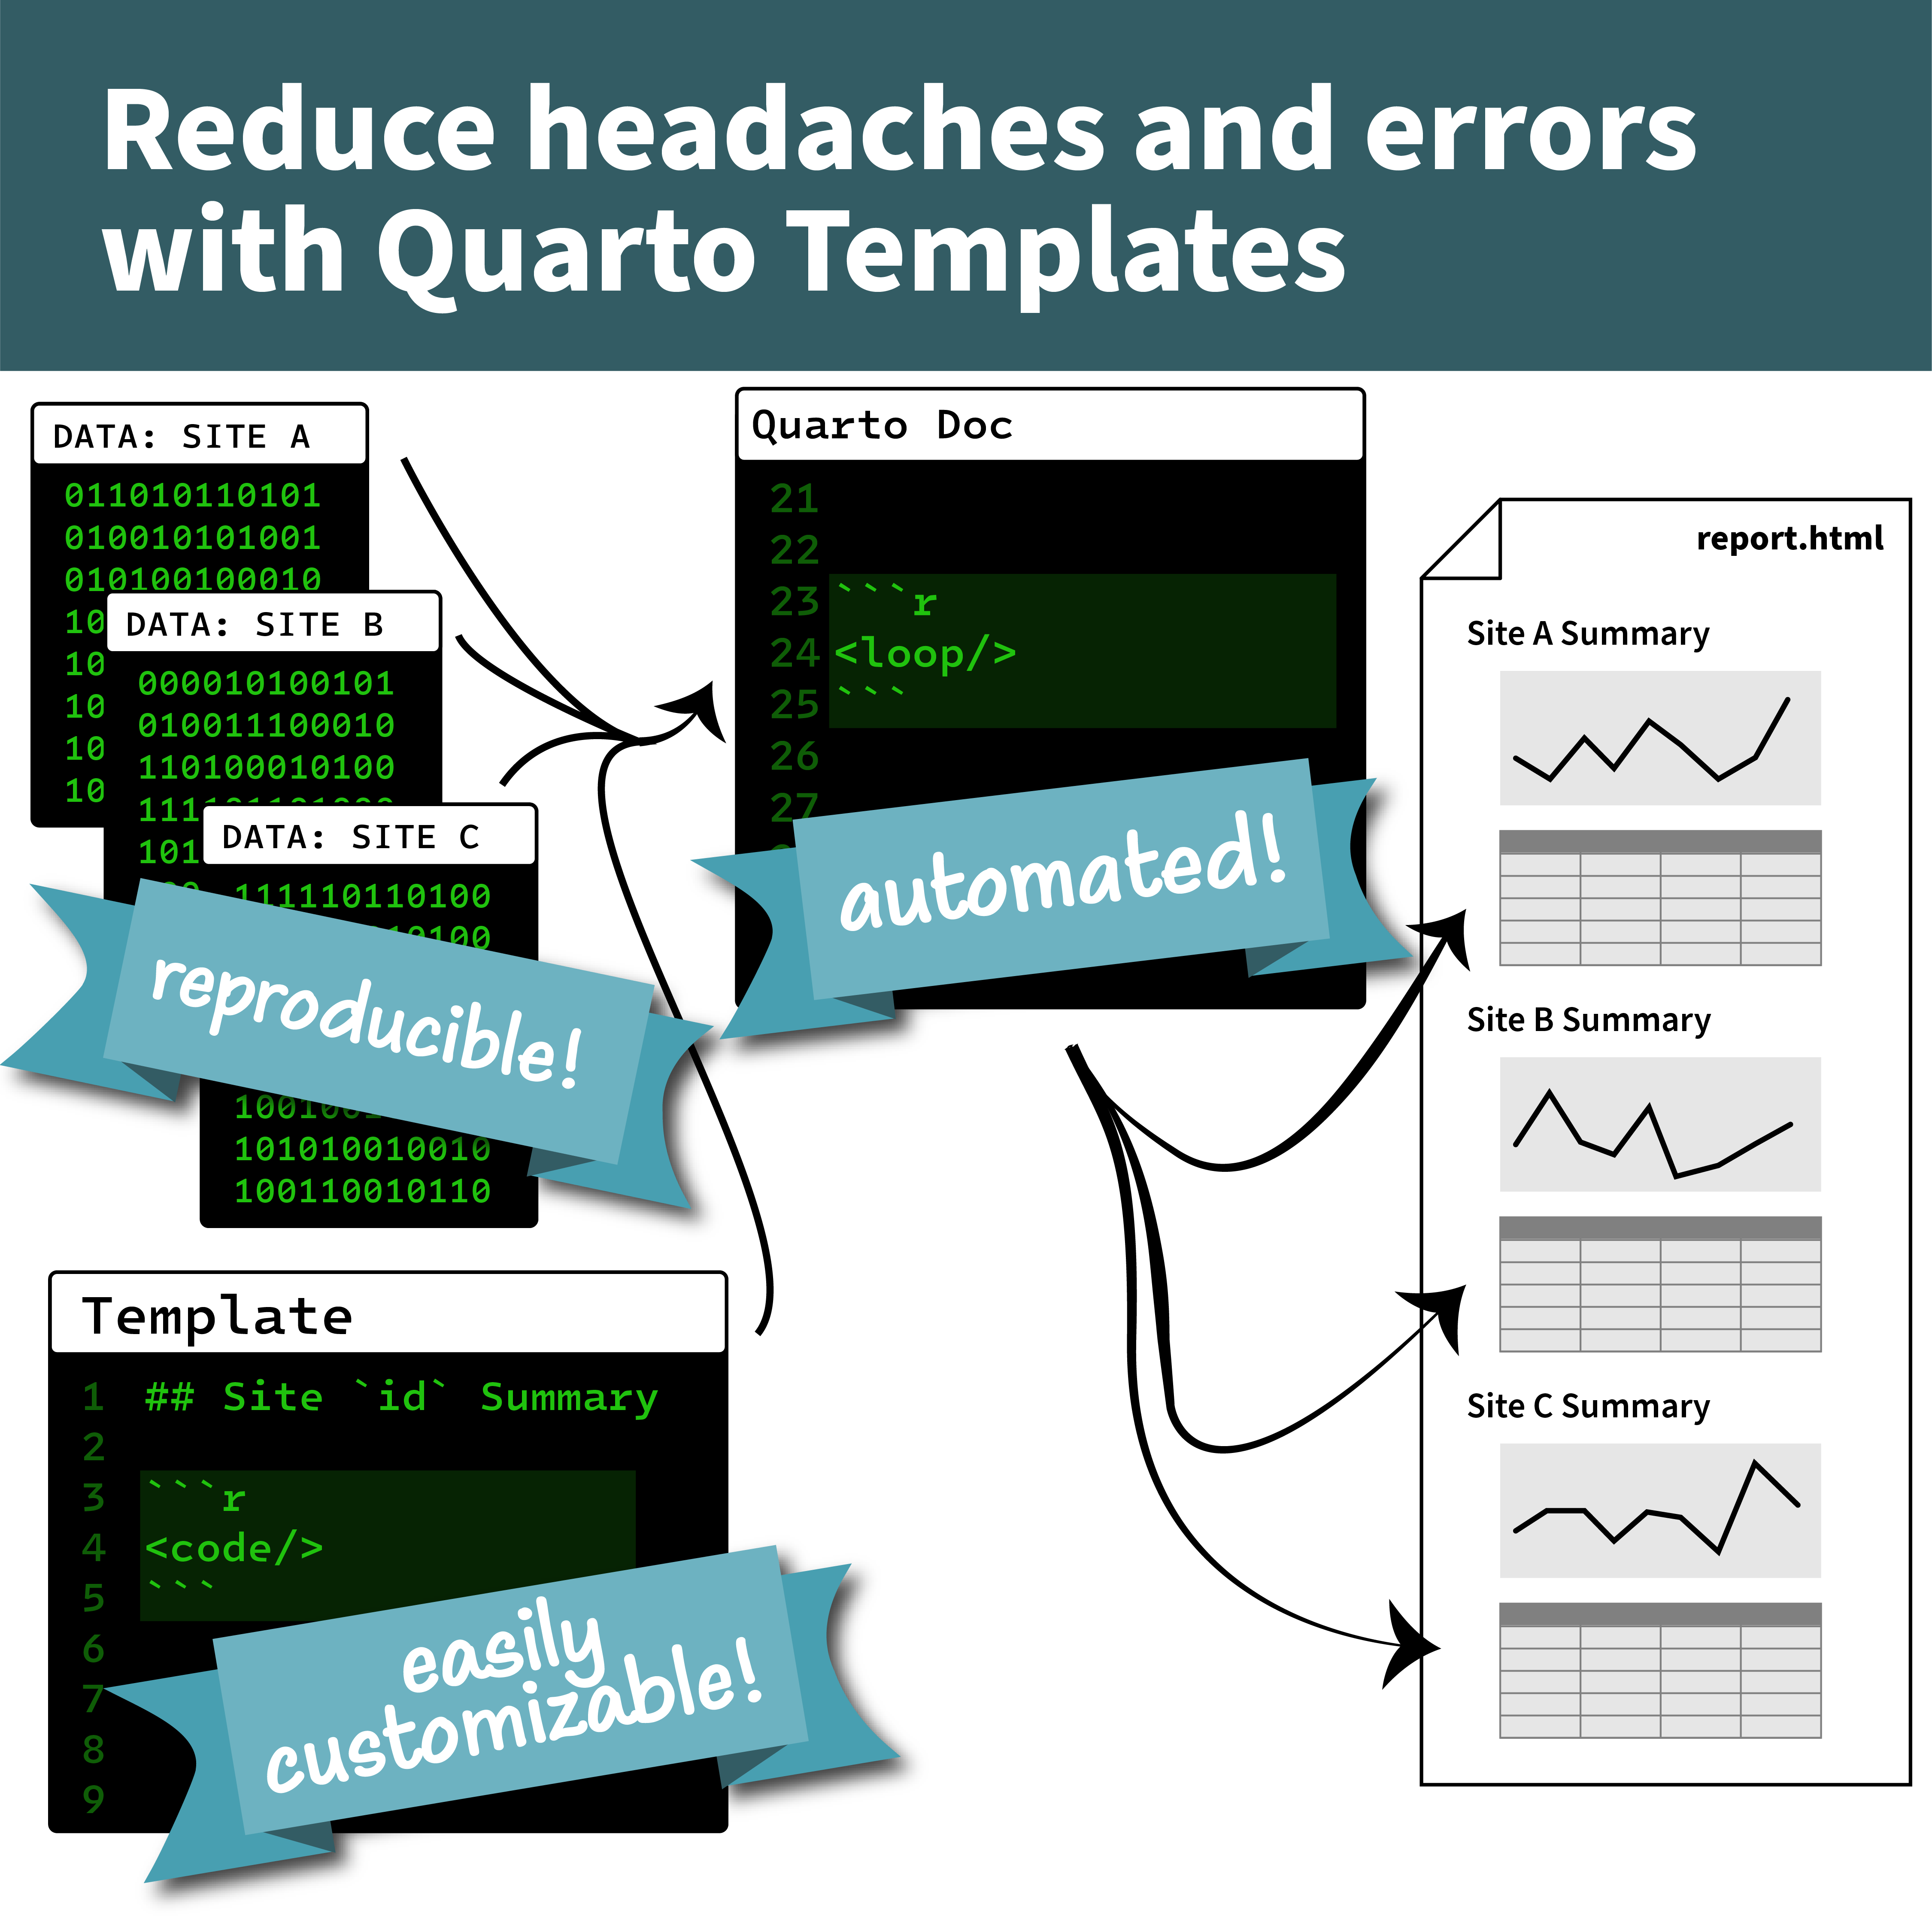
Quarto provides easier-than-ever ways to create data-driven, reproducible documents. This blog demonstrates how to use custom code templates to easily replicate code chunks with a reproducible USGS streamgage example!
Official websites use .gov
A .gov website belongs to an official government organization in the
United States.
Secure .gov websites use HTTPS
A lock (
) or https:// means you’ve safely connected to the .gov website. Share
sensitive information only on official, secure websites.
Quarto provides easier-than-ever ways to create data-driven, reproducible documents. This blog demonstrates how to use custom code templates to easily replicate code chunks with a reproducible USGS streamgage example!
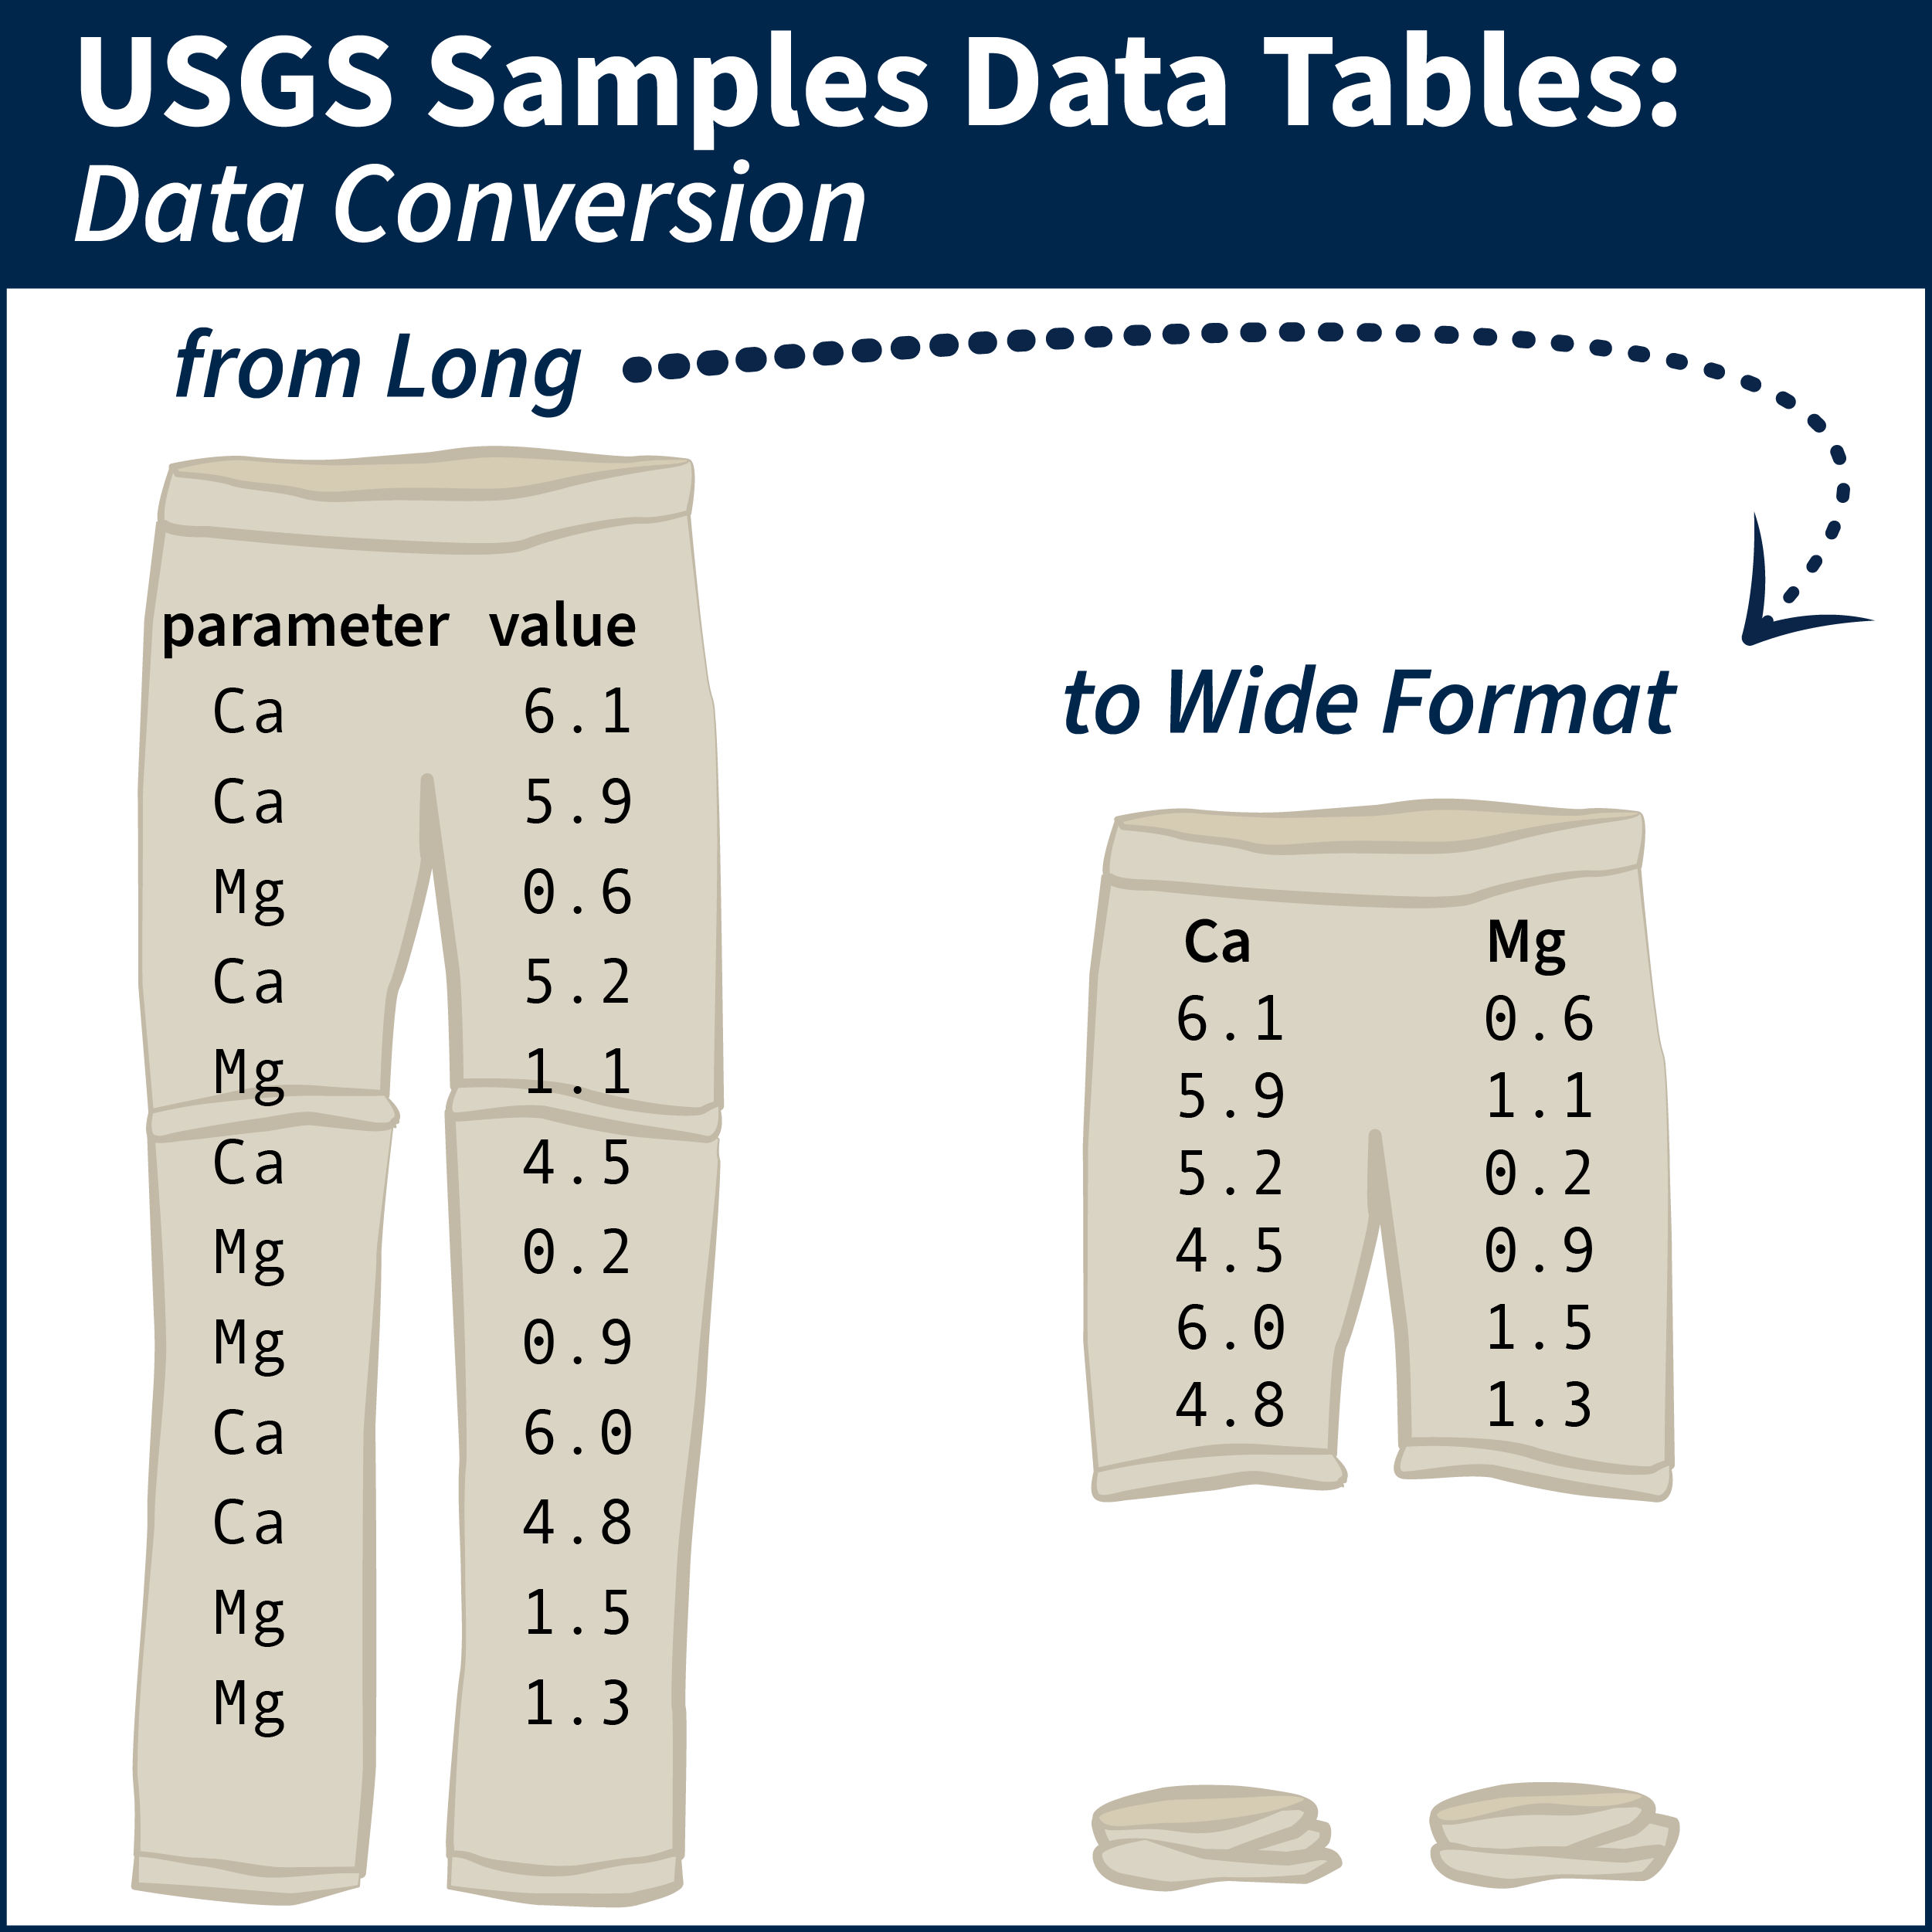
Tips and example R scripts for converting long-formatted data into wide tabular format
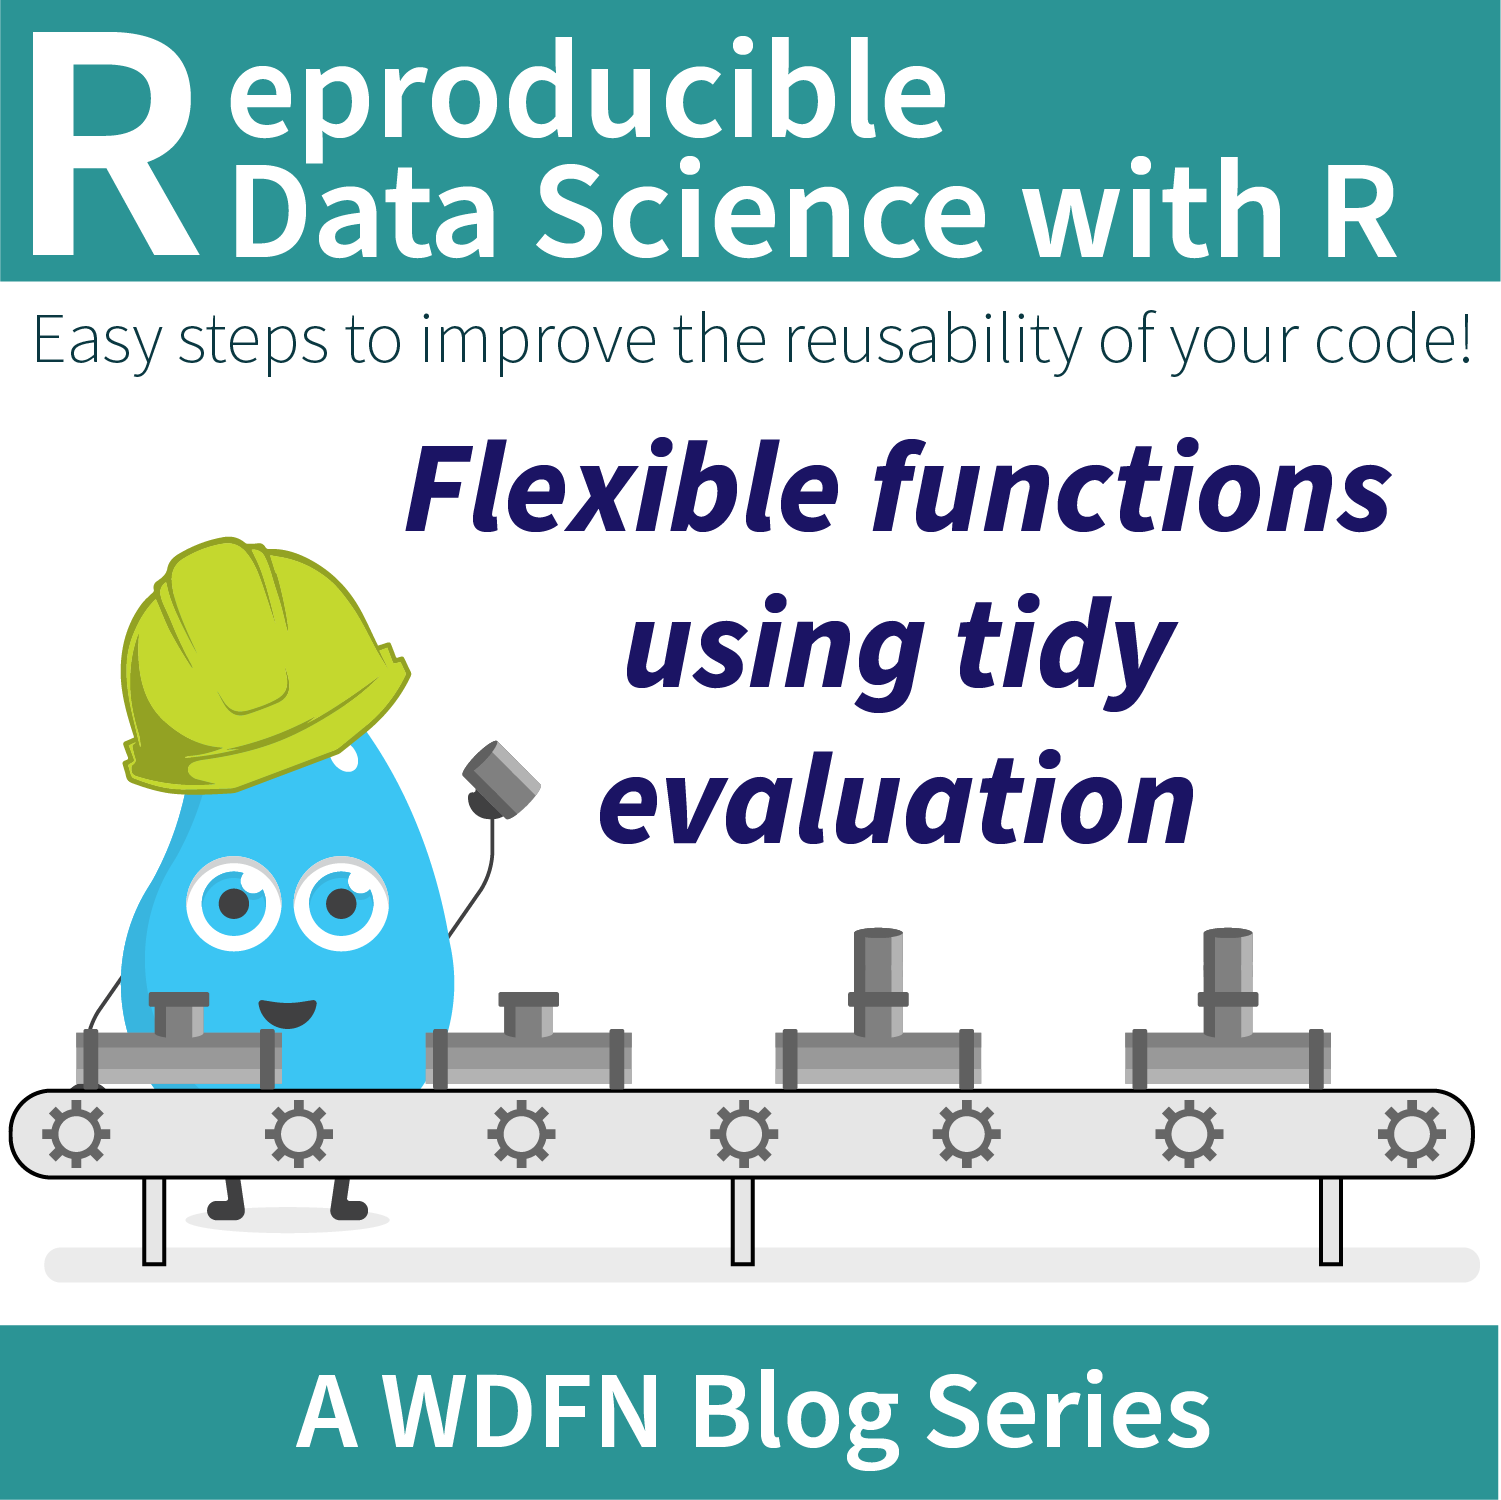
Improve your functions with helpful dataframe evaluation patterns.
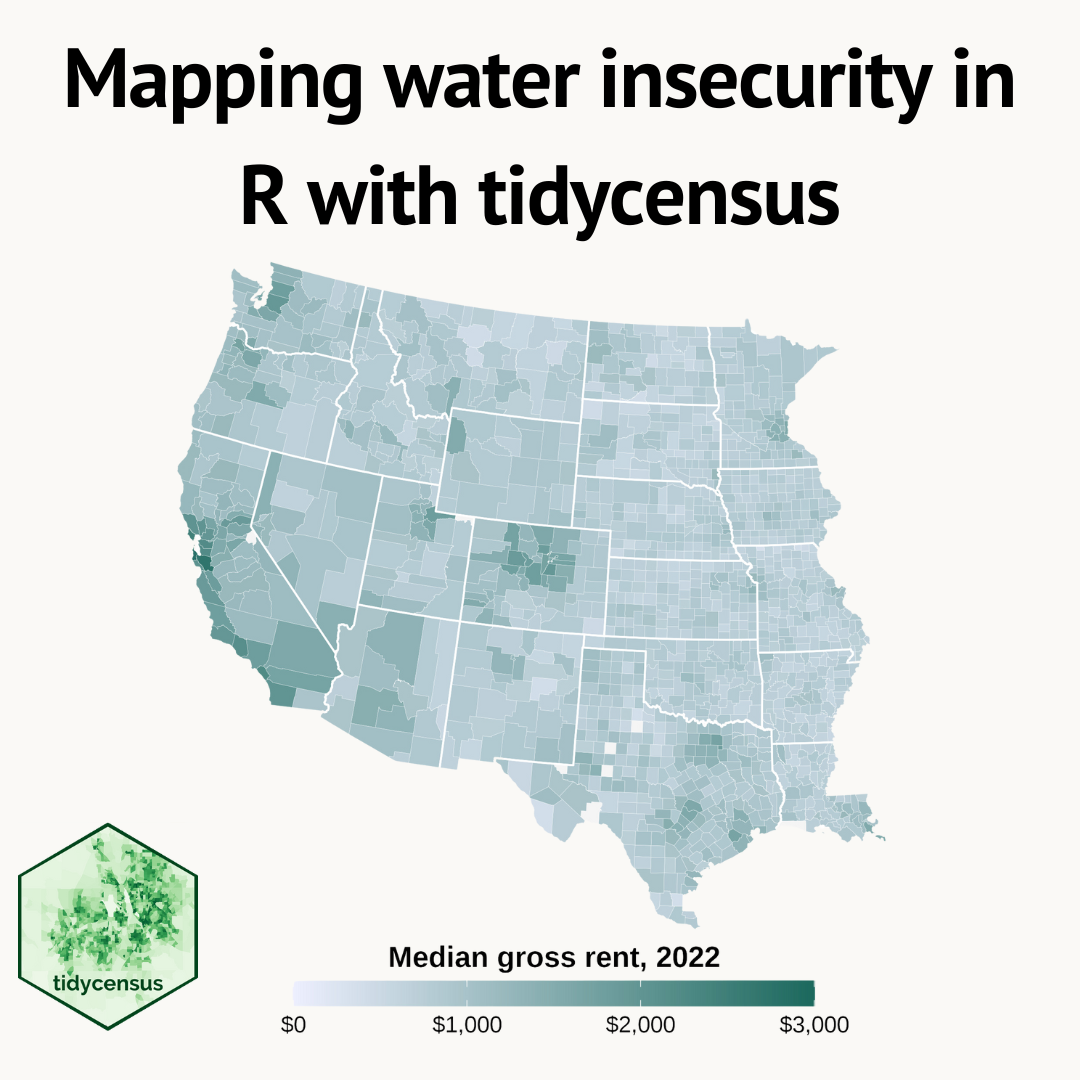
Using the tidycensus package to access and visualize American Community Survey (ACS) data.
hyswap is an open-source Python package that is designed to enable cooperators, stakeholders and the public to calculate summary hydrologic statistics and create maps, tables and visualizations for critical decision-making. Access the package at https://github.com/DOI-USGS/hyswap .
This blog describes a mapping file available to users to ease the transition to the WQX version 3.0 format. The spreadsheet provides high-level mapping of data fields in the legacy NWIS format to WQX fields.
Iterate your R code using the map() function from the purrr package.
Write functions in R that run better and are easier to understand.
Learn the ropes building your own functions in R using water data examples.
Submit to the river chlorophyll forecasting challenge, co-hosted by the USGS Water Mission Area and Ecological Forecasting Initiative.