The GDP web interface, processing service, and THREDDS data server are being retired.
Official websites use .gov
A .gov website belongs to an official government organization in the
United States.
Secure .gov websites use HTTPS
A lock (
) or https:// means you’ve safely connected to the .gov website. Share
sensitive information only on official, secure websites.
The GDP web interface, processing service, and THREDDS data server are being retired.
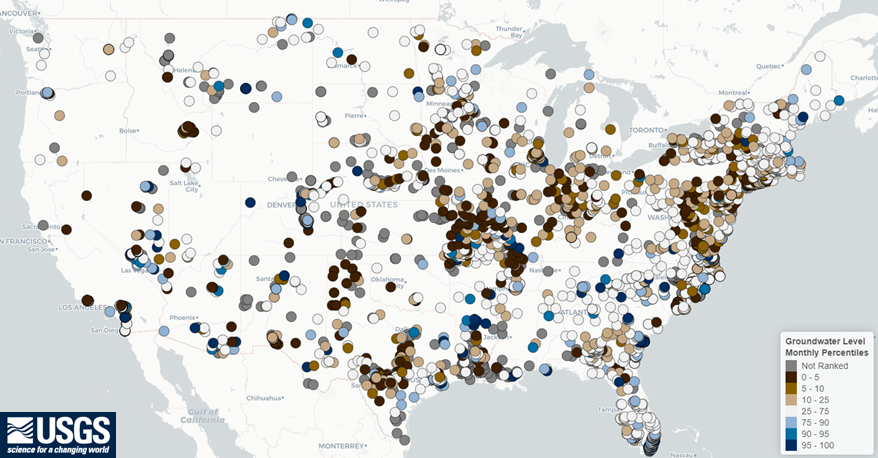
A new, experimental application for viewing groundwater levels with historical context and for generating site-level reports.
USGS is improving the way that sample data are stored and served to the public. These changes will affect our back-end data management systems, web services, application programming interfaces (APIs), computational tools, and user interfaces for accessing data.
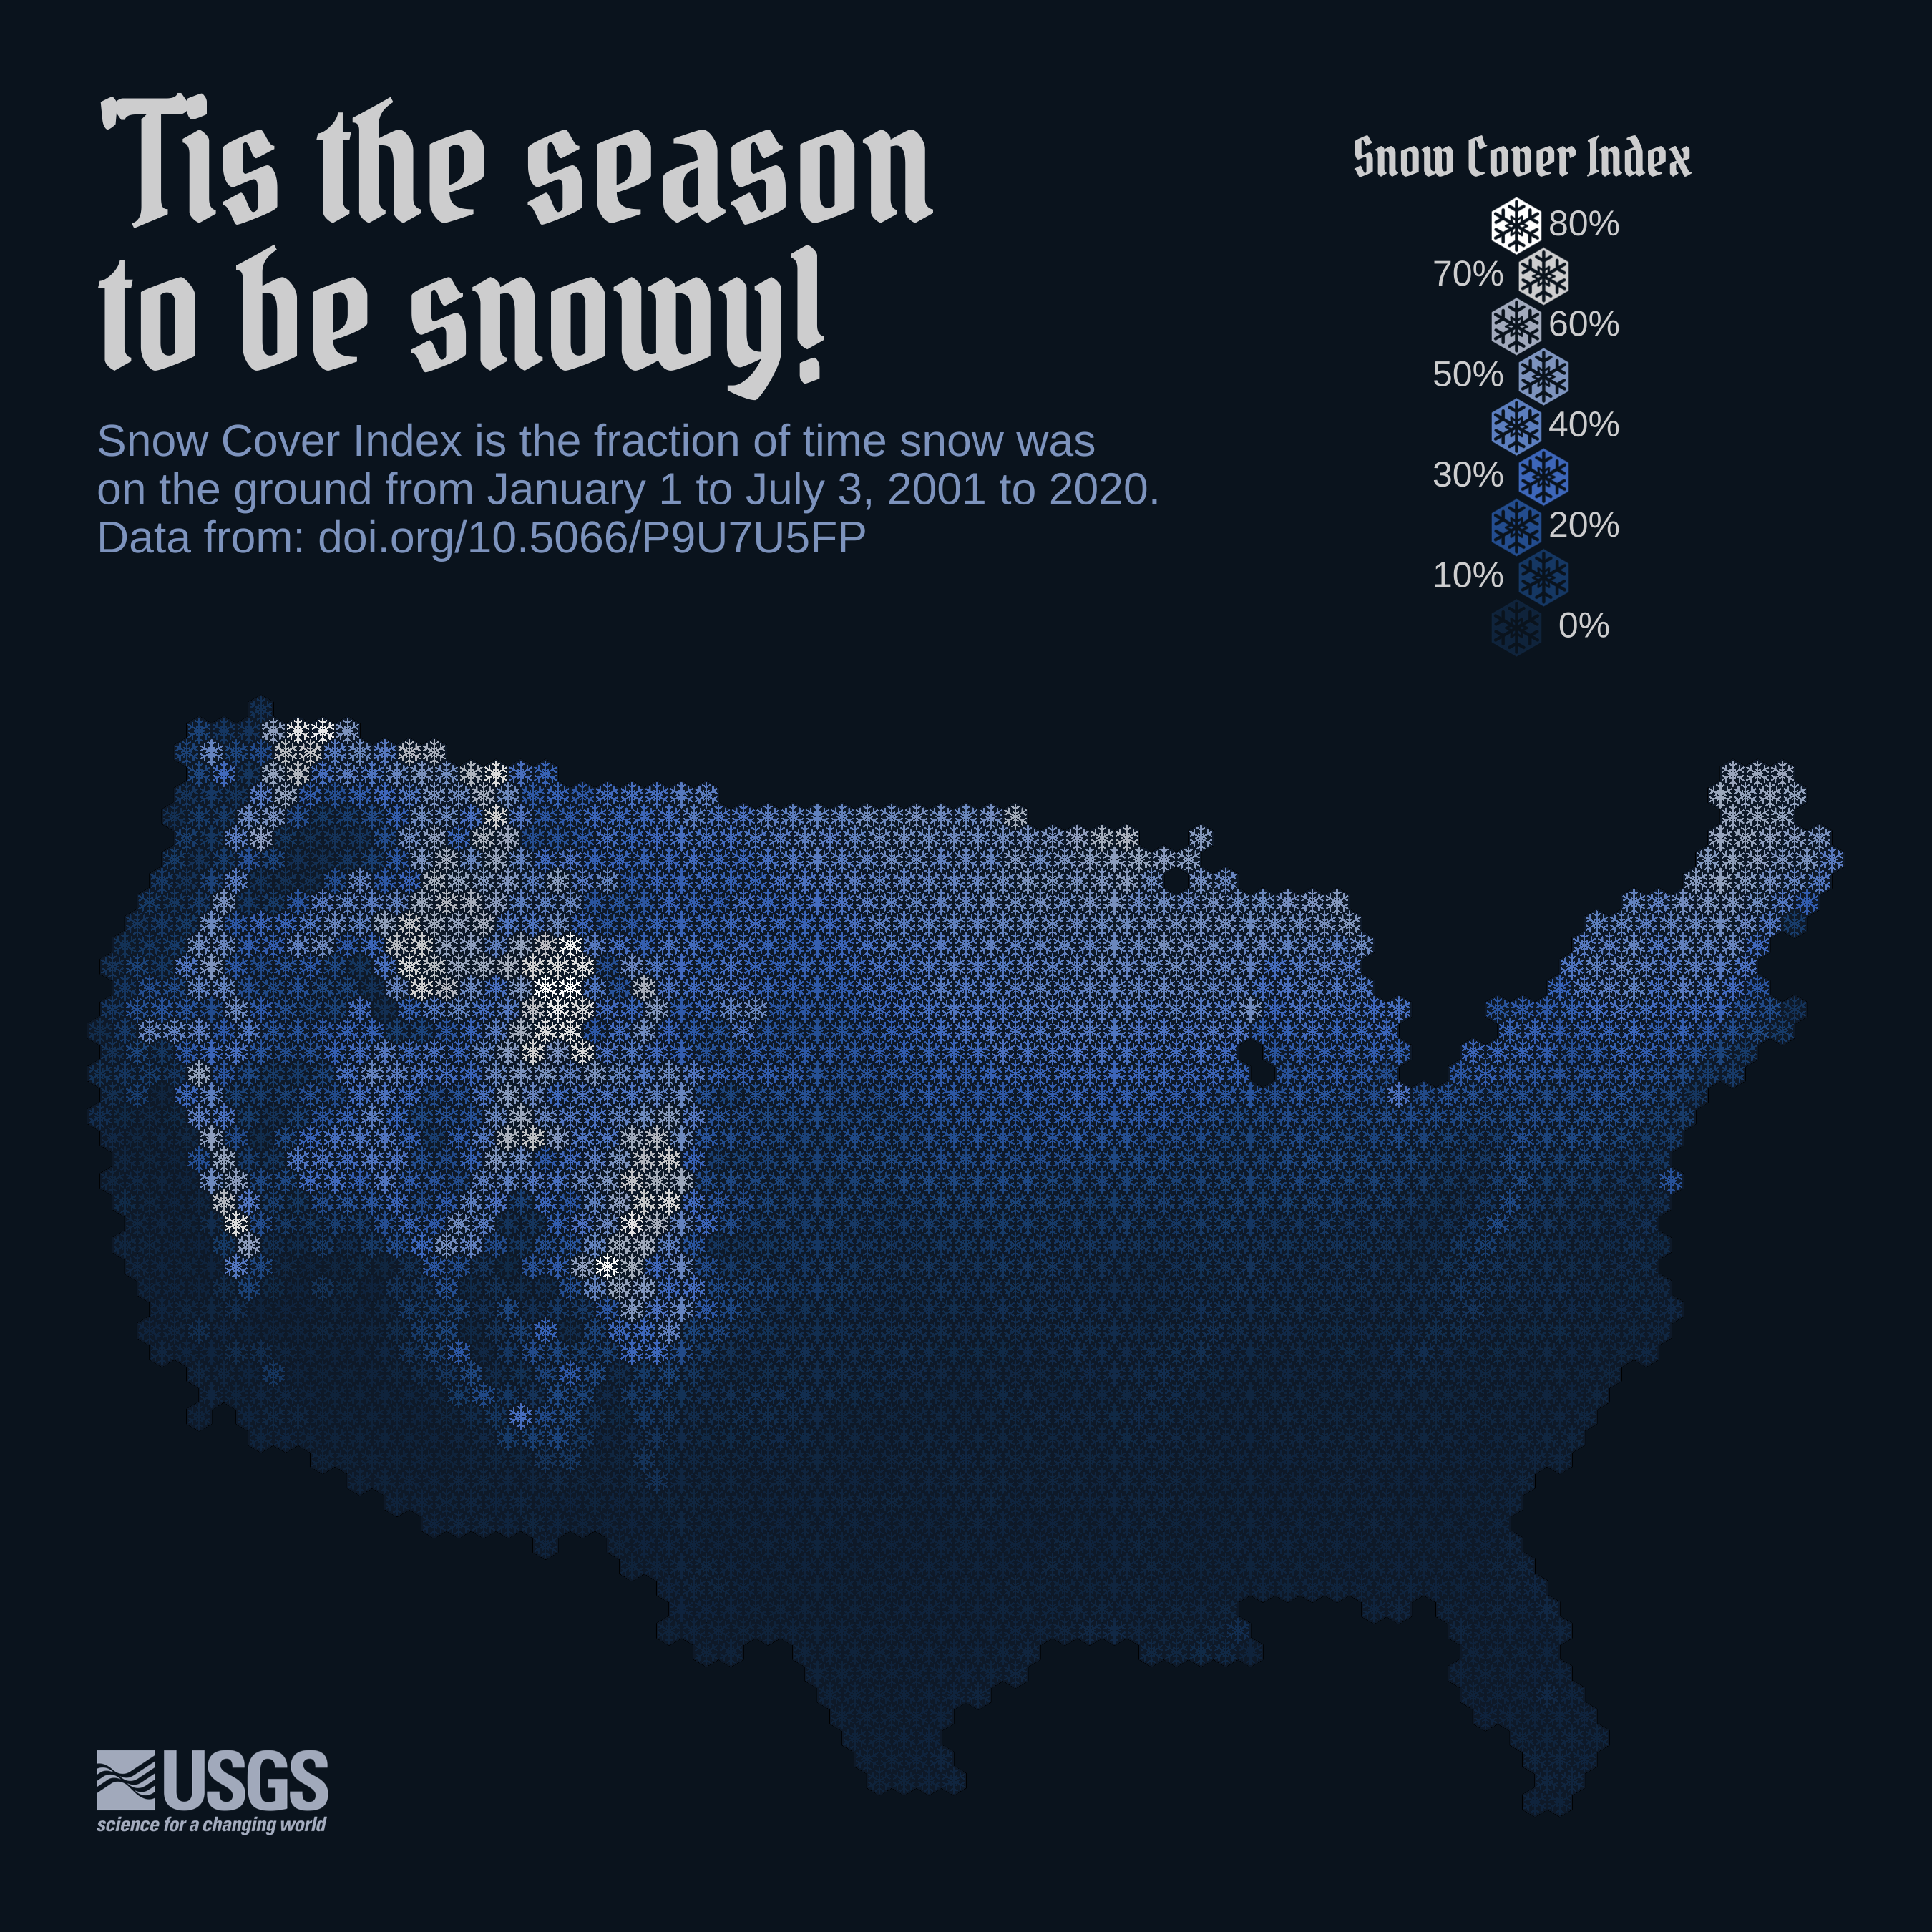
Reproducible code demonstrating the evolution of a recent data viz of snow cover in the lower 48 United States
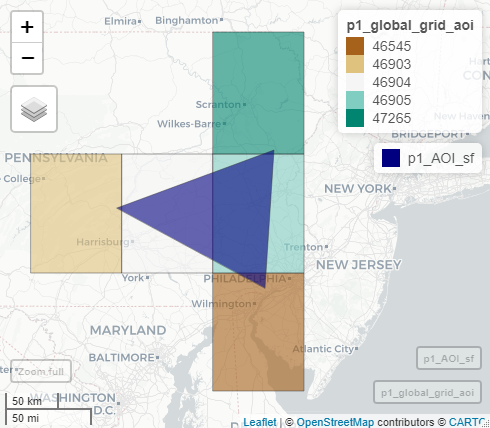
A pipeline-based approach for making large data pulls from Water Quality Portal
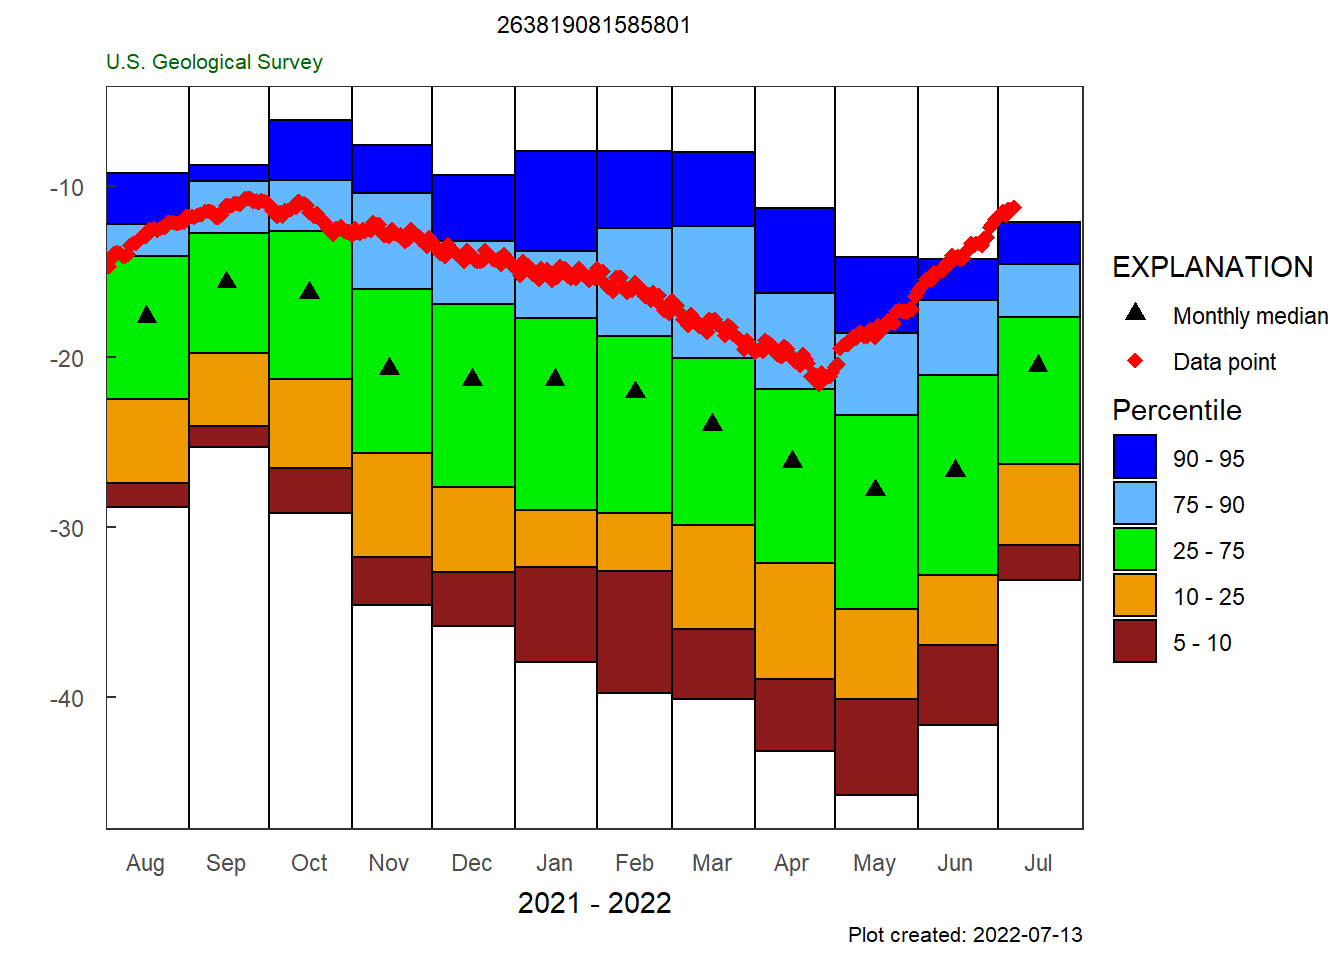
Introduction to HASP package for groundwater data.
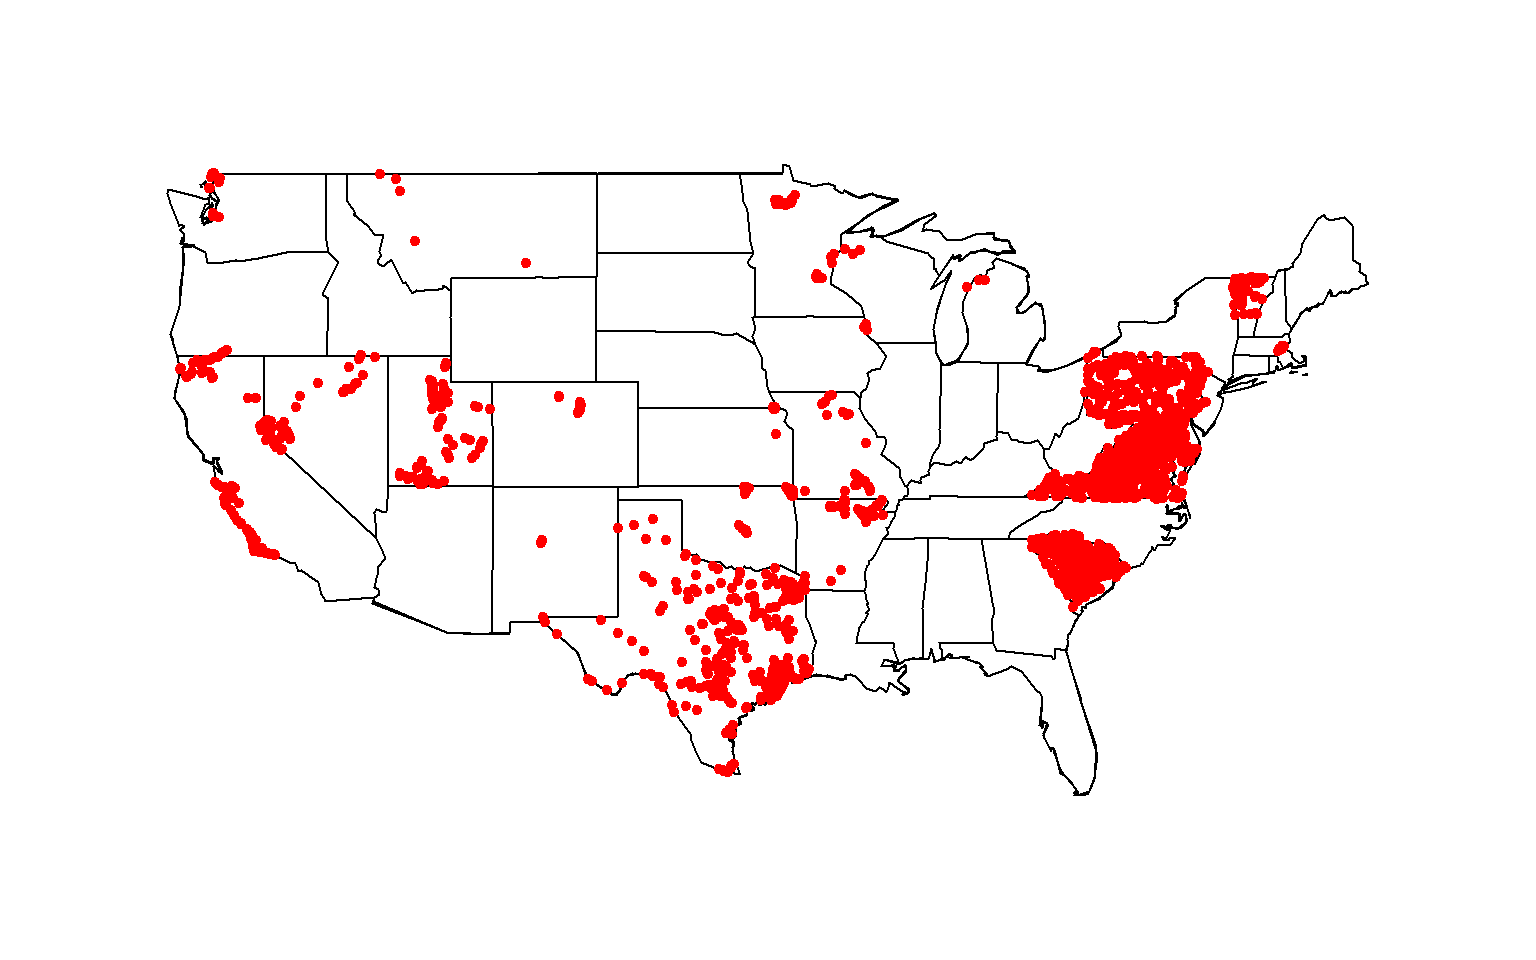
Large pull for all total nitrogen data for streams in the contiguous United States with sites that have at least 40 measurements between 1995 and 2020.